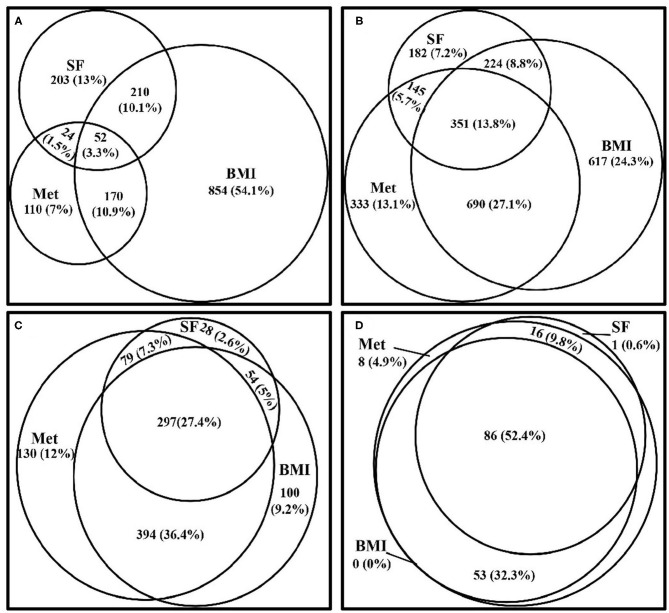
Figure 2.
Venn diagrams visually display how the three status (metabolically at-risk, overweight/obesity, and high serum ferritin) cluster together in the samples within 0–3 of the CVD risk factors, diabetes, hyperuricemia, and dyslipidemia, from the CVD risk profiles. (A) Venn diagram showing the clustering of the three status in subjects who did not exhibit any of the CVD risk factors. (B) Venn diagram showing the clustering of the three status in subjects who exhibited one of the CVD risk factors. (C) Venn diagram showing the clustering of the three status in subjects who exhibited two of the CVD risk factors. (D) Venn diagram showing the clustering of the three status in subjects who exhibited all three of the CVD risk factors. Met, metabolically at-risk; BMI, overweight/obesity; SF, high serum ferritin; CVD, cardiovascular disease.

