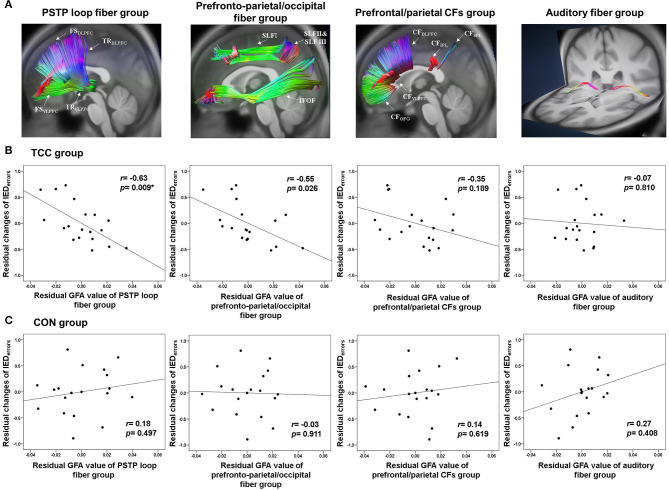
Figure 2.
(A) Reconstruction of the PSTP loop, prefronto-parietal/occipital, prefrontal/parietal CFs, and auditory fiber groups using the TBAA procedure. (B) Partial correlation plots of the GFA values of the PSTP loop, prefronto-parietal/occipital, prefrontal/parietal CFs, and auditory fiber groups with normalized changes of the number of total errors of the IED test for the TCC group. (C) Partial correlation plots of these four GFA values with normalized changes of the number of total errors of the IED test for the CON group. CFs, callosal fibers; CON, control group; GFA, generalized fractional anisotropy; IED, Intra-Extra Dimensional Set Shift; PSTP, prefronto-striato-thalamo-prefrontal; TCC, Tai Chi Chuan group. *p < 0.0125 (=0.05/4 adjusted): significant correlations.

