Figure 4.

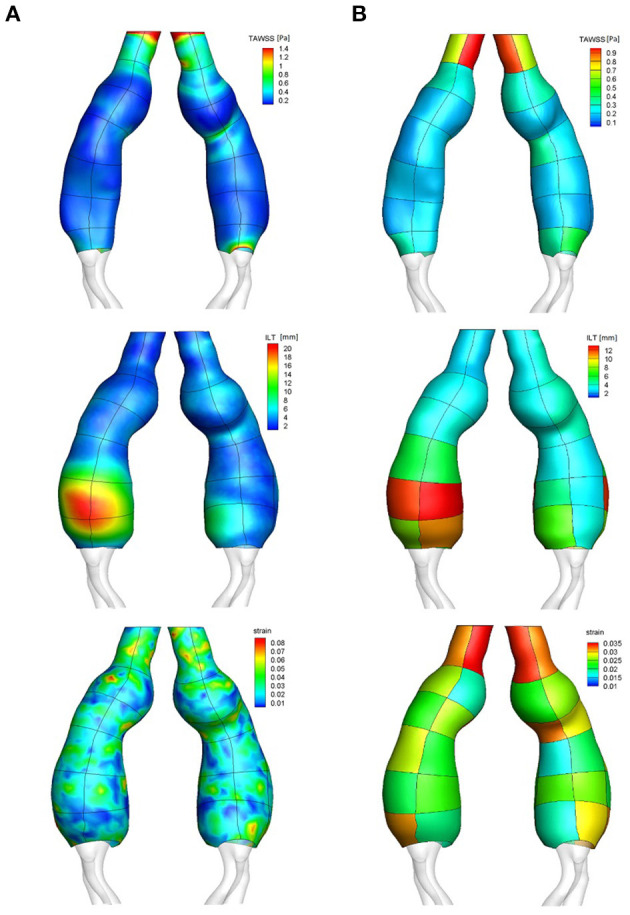
Surface distribution (column A) with patches outline visible on top of the distribution, and patch-averaged distribution (column B) of TAWSS, ILT thickness and maximum principal strain: case example.

Surface distribution (column A) with patches outline visible on top of the distribution, and patch-averaged distribution (column B) of TAWSS, ILT thickness and maximum principal strain: case example.