
Figure 5.
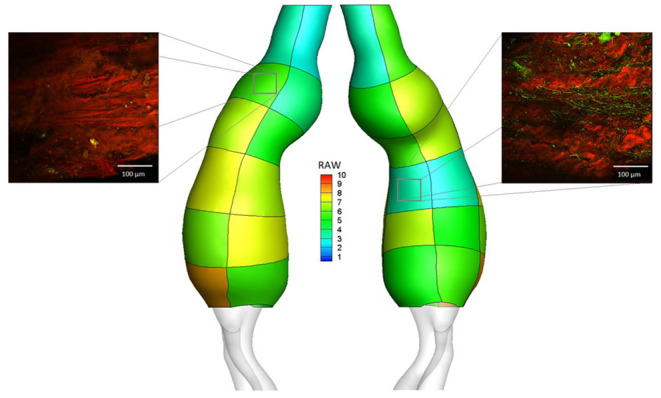
RAW distribution on regions defined on the external wall for the AAA case example. Micrographs are reported for two of the collected samples: region LA2 (RAW = 5.56, elastin abundance score 1, Ultimate Tensile Strength from uniaxial tensile test UTS = 0.21 MPa) and region RP4 (RAW = 3.33, elastin abundance score 4, Ultimate Tensile Strength from uniaxial tensile test UTS = 0.86 MPa). Microscopy analysis was performed on a total of 73 aortic samples; uniaxial tensile testing was performed on a total of 97 aortic samples.