Figure 2.
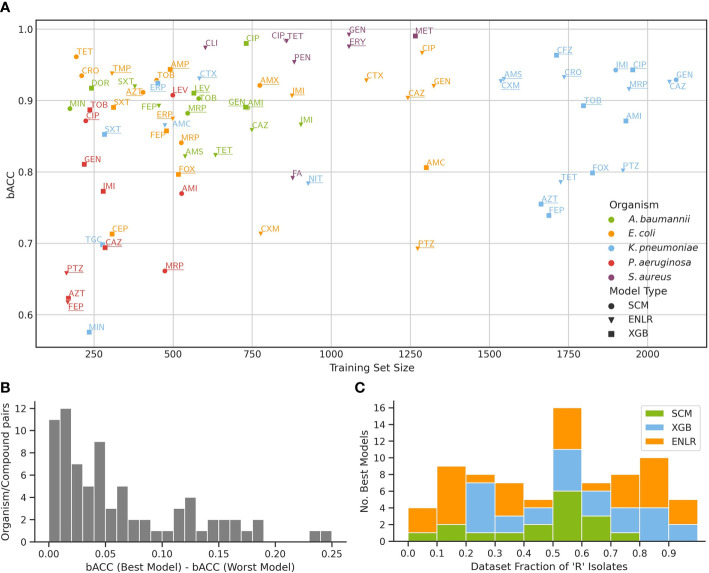
Benchmark of three ML algorithms on the prediction of antimicrobial resistance from WGS data. (A) Predictive performance of models for each organism/compound pair as a function of training set size. For each pair, performance of a model with the highest bACC is shown, and underlined if the stacking model outperformed it. The mapping of compound names to compound abbreviations is given in Supplementary Table S4 . (B) Distribution of bACC differences between the models with highest and lowest bACC for all organism/compound pairs. (C) Number of top performing models from each algorithm as a function of the fraction of resistant isolates in the training set.

