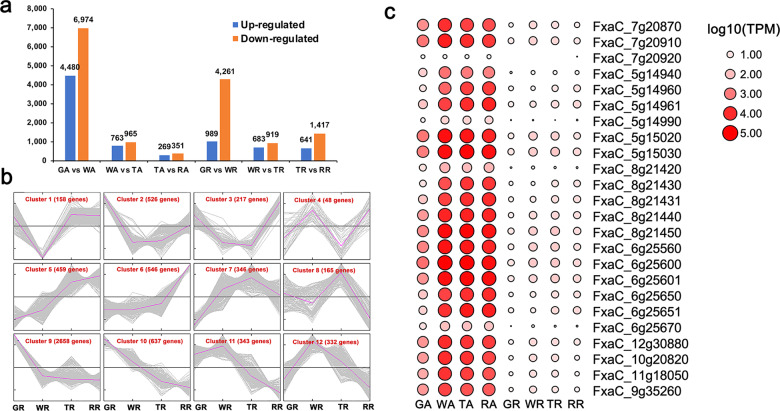
Fig. 4. Differentially expressed genes (DEGs) during fruit development.
a Number of differentially expressed genes identified in the successive transition from the green (G), white (W), turning (T), and red (R) stages in the receptacles (Rs) and in achene (As). b Average profiles of twelve gene clusters of genes in the receptacle. Line plot showing the expression of genes in the twelve gene clusters. The number of genes in each cluster is shown. The Y-axis represents the z-score obtained from the expression level (TPM). c Heatmap of F. ananassa CRU1 genes expressed in different tissues. GR Green receptacle, WR White receptacle, TR Turning receptacle, RR Red receptacle, GA Green achene, WA White achene, TA Turning achene, RA Red achene

