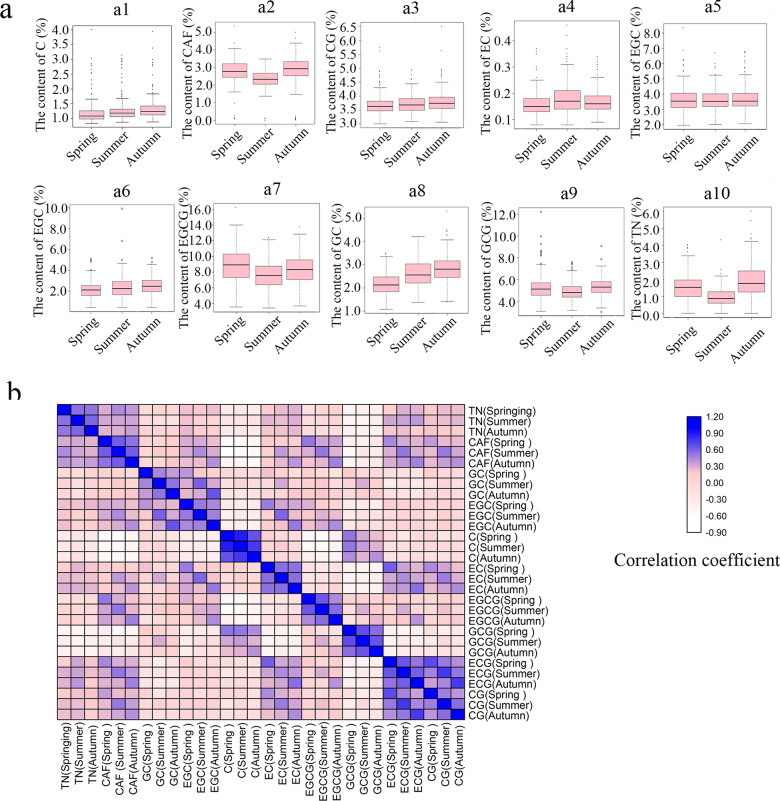
Fig. 1. Levels of 10 metabolites in 191 germplasms in three seasons.
a Box charts of 10 metabolites in 191 germplasms in three seasons. The seasons are presented on the abscissa, whereas the metabolite dry matter levels are presented on the ordinate. a1, C; a2, CAF; a3, CG; a4, EC; a5, ECG; a6, EGC; a7 EGCG; a8, GC; a9, GCG; a10, TN. b Heat map presenting the correlations among metabolite levels in different seasons. The depth of the scale color represents the strength of the correlation

