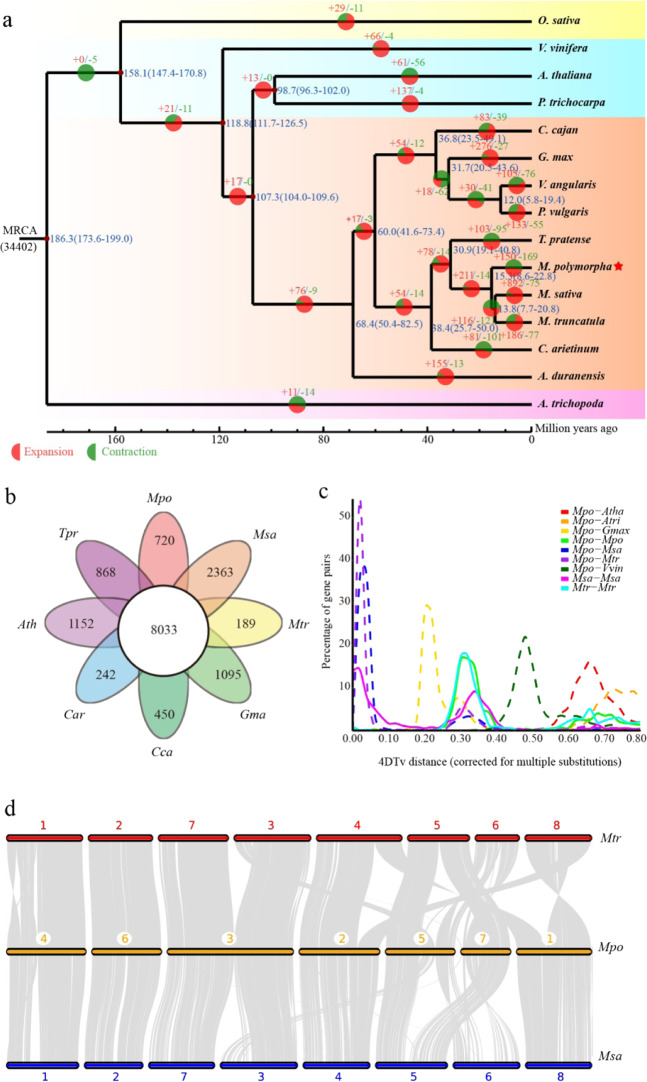
Fig. 2. Comparative genomic analysis of the M. polymorpha genome.
a Phylogenetic tree of 14 species, showing gene family expansion and contraction relative to the most recent common ancestor. The numeric value beside each node indicates the estimated divergence time of each node (blue) and the number of expanded (red) and contracted (green) gene families. b Venn diagram showing the shared and unique gene families among M. polymorpha and seven other plant species (Mpo, M. polymorpha; Msa, M. sativa; Mtr, M. truncatula; Ath, A. thaliana; Car, C. arietinum; Cca, C. cajan; Tpr, T. pratense). c 4DTv analysis. The x-axis represents the 4DTv value, and the y-axis represents the proportion of genes corresponding to each 4DTv value. d Synteny analysis of M. polymorpha, M. truncatula, and M. sativa

