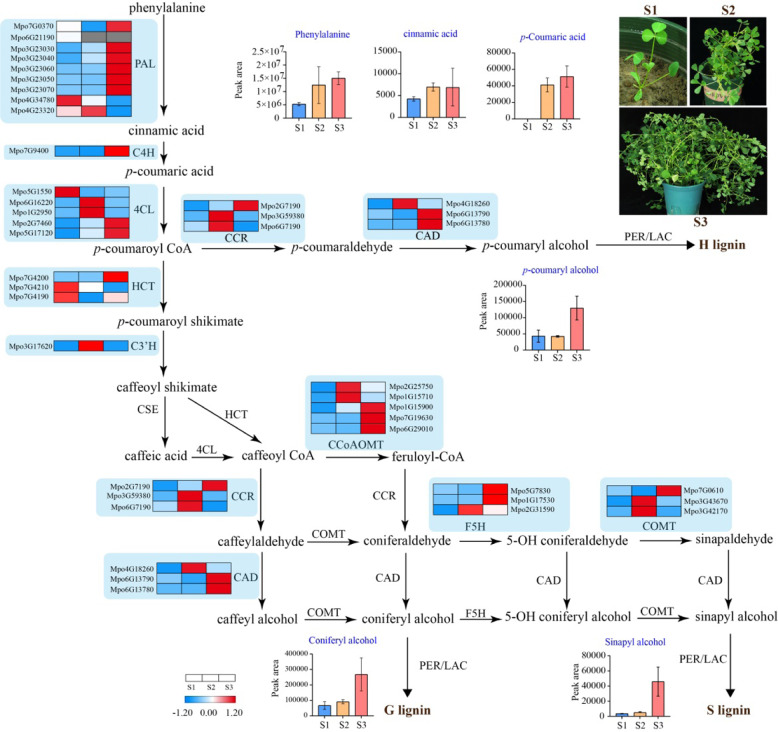
Fig. 4. Diagram of the lignin biosynthetic pathway.
Heatmaps showing the expression levels of lignin-biosynthesis-related genes at various growth stages. The expression values (FPKM) at the row scale were normalized. Higher mRNA expression levels are indicated by red, and lower mRNA expression levels are indicated by blue, whereas nonexpressed mRNAs are shown in gray; column diagrams show the levels of metabolites in the lignin biosynthetic pathway

