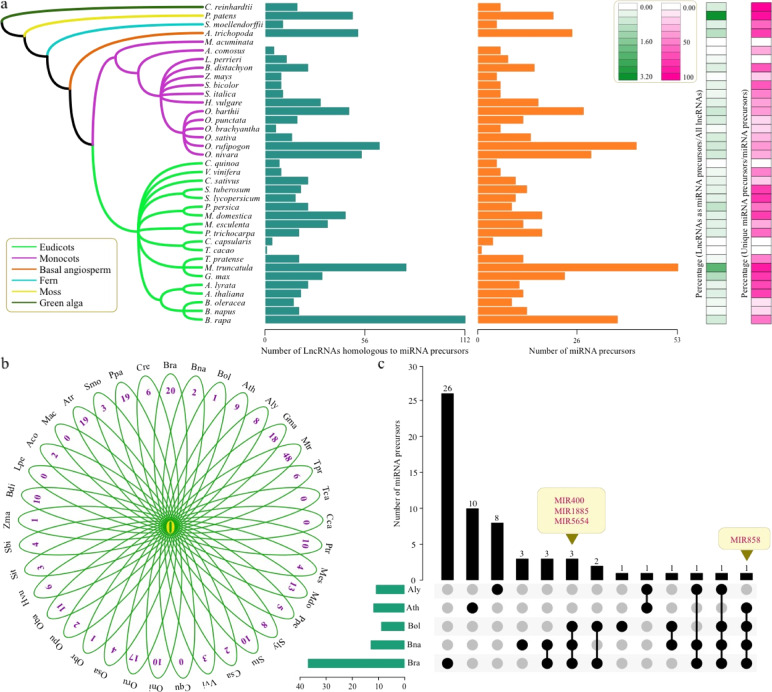
Fig. 3. Comparative analysis of lncRNAs homologous to miRNA precursors in 37 species.
a The green bar plot shows the number lncRNAs homologous to miRNA precursors in all examined species. The orange bar plot shows the number of homologous miRNA precursors. The green heatmap indicates the percentage of lncRNA numbers as miRNA precursors and all lncRNAs in each species. The red heatmap indicates the percentage of unique miRNA precursors and all miRNA precursors in each species. b Number of common and unique miRNA precursors in all 37 species. c Number of common and unique miRNA precursors in five Brassicaceae species

