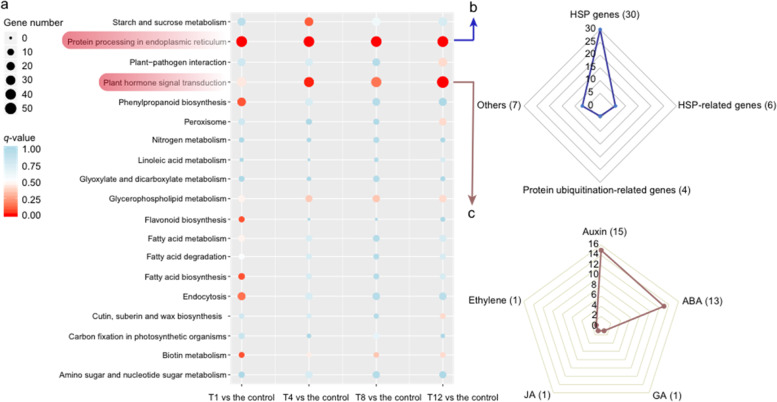
Fig. 7. KEGG enrichment analysis of DE lncRNA-trans-regulated genes in different comparison groups.
a Combination of the top 10 enriched pathways of each comparison. The size of each dot indicates the number of enriched genes in this pathway, and the color of each dot corresponds to different q value ranges. b–c Number of genes in different functional groups in the “protein processing in endoplasmic reticulum” and “plant hormone signal transduction” pathways. ABA, GA, and JA represent abscisic acid, gibberellin, and jasmonic acid, respectively

