
Figure 1.
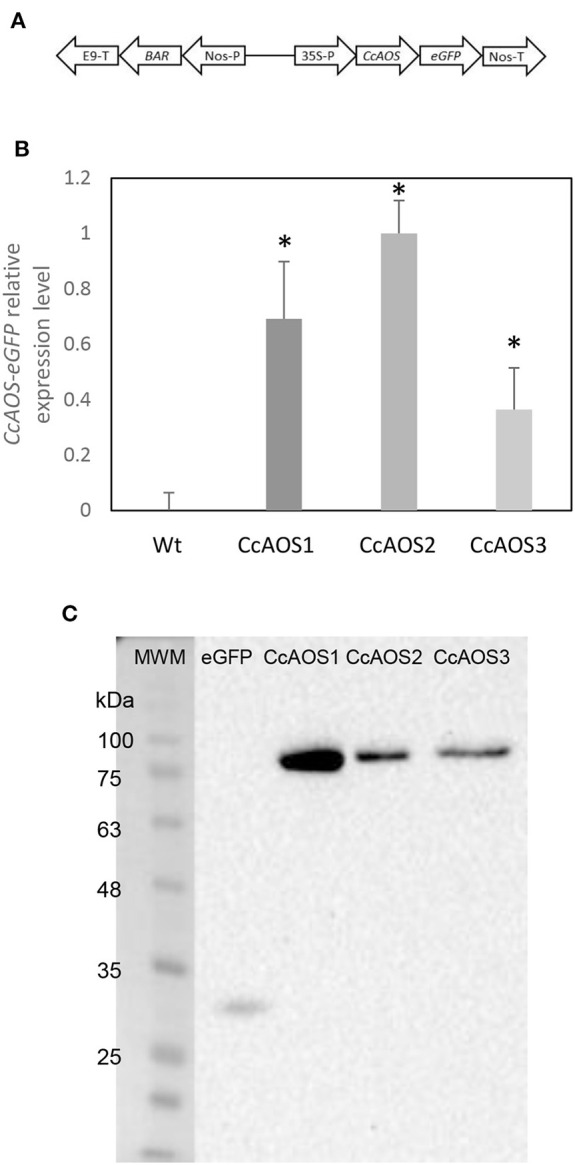
Molecular characterization of transgenic Arabidopsis plants expressing CcAOS. (A) Schematic diagram of the CcAOS-eGFP construct used for transformation. 35S-P: CaMV 35S RNA promoter; Nos-T: Nopaline synthase terminator; Nos-P: Nopaline synthase promoter; BAR: Phosphinothricin N-acetyltransferase coding sequence; E9-T: pea rbcS-E9 terminator. (B) Relative expression levels of CcAOS-eGFP in 2-week-old transgenic plants. Wild type Ler-0 was used as negative control. Expression levels were normalized to the Actin2 (At3g18780) reference gene. The highest level of expression in CcAOS2 was set to 1 and used as calibrator. Error bars represent the standard deviation of the mean (n = 3). Asterisks indicate significant differences in the expression between transformed plants with P < 0.005 (t-test). (C) CcAOS-eGFP protein expression in 2-week-old transgenic plants. An eGFP monoclonal antibody was used in hybridization and plants transformed with the empty vector were used as positive control for eGFP (2nd lane). Molecular weights: eGFP 27 KDa; CcAOS-eGFP 77 KDa. Image representative of three independent experiments.