Figure 2.

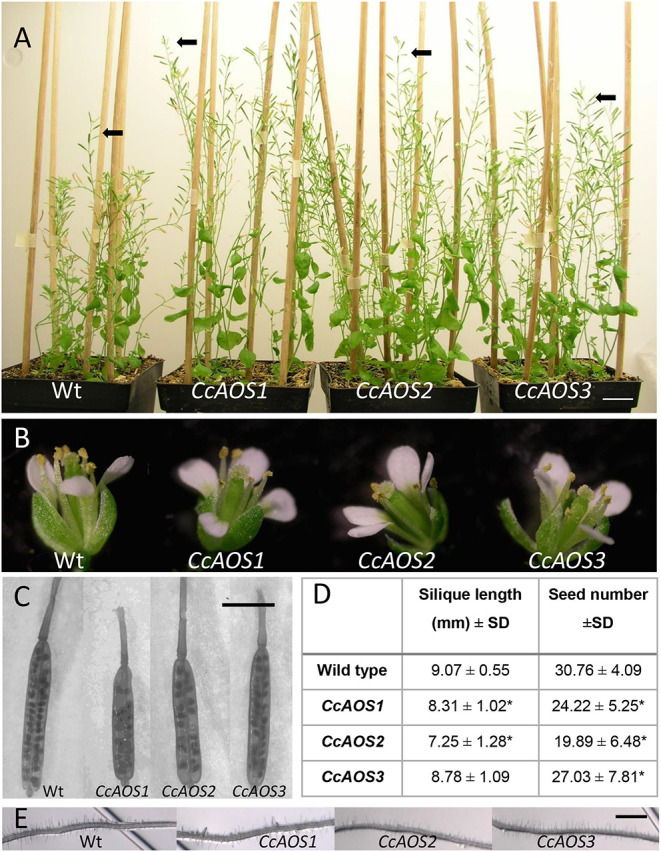
Phenotypical characterization of transgenic Arabidopsis plants expressing CcAOS-eGFP. (A) Two-month-old wild type (Ler-0) and transgenic CcAOS plants. Arrowheads indicate flower stalks' height. Scale bar = 2 cm. (B) Detail of flowers from plants depicted in (A). (C) Detail of siliques collected from plants depicted in (A). Bar = 5 mm. (D) Average silique length and seed number (±SD; n = 3) collected from plant lines depicted in (A). Asterisks indicate significant differences when compared to Ler-0 plants with P < 0.05 (t-test). (E) Detail of roots from plants depicted in A. Scale Bar = 100 μm.
