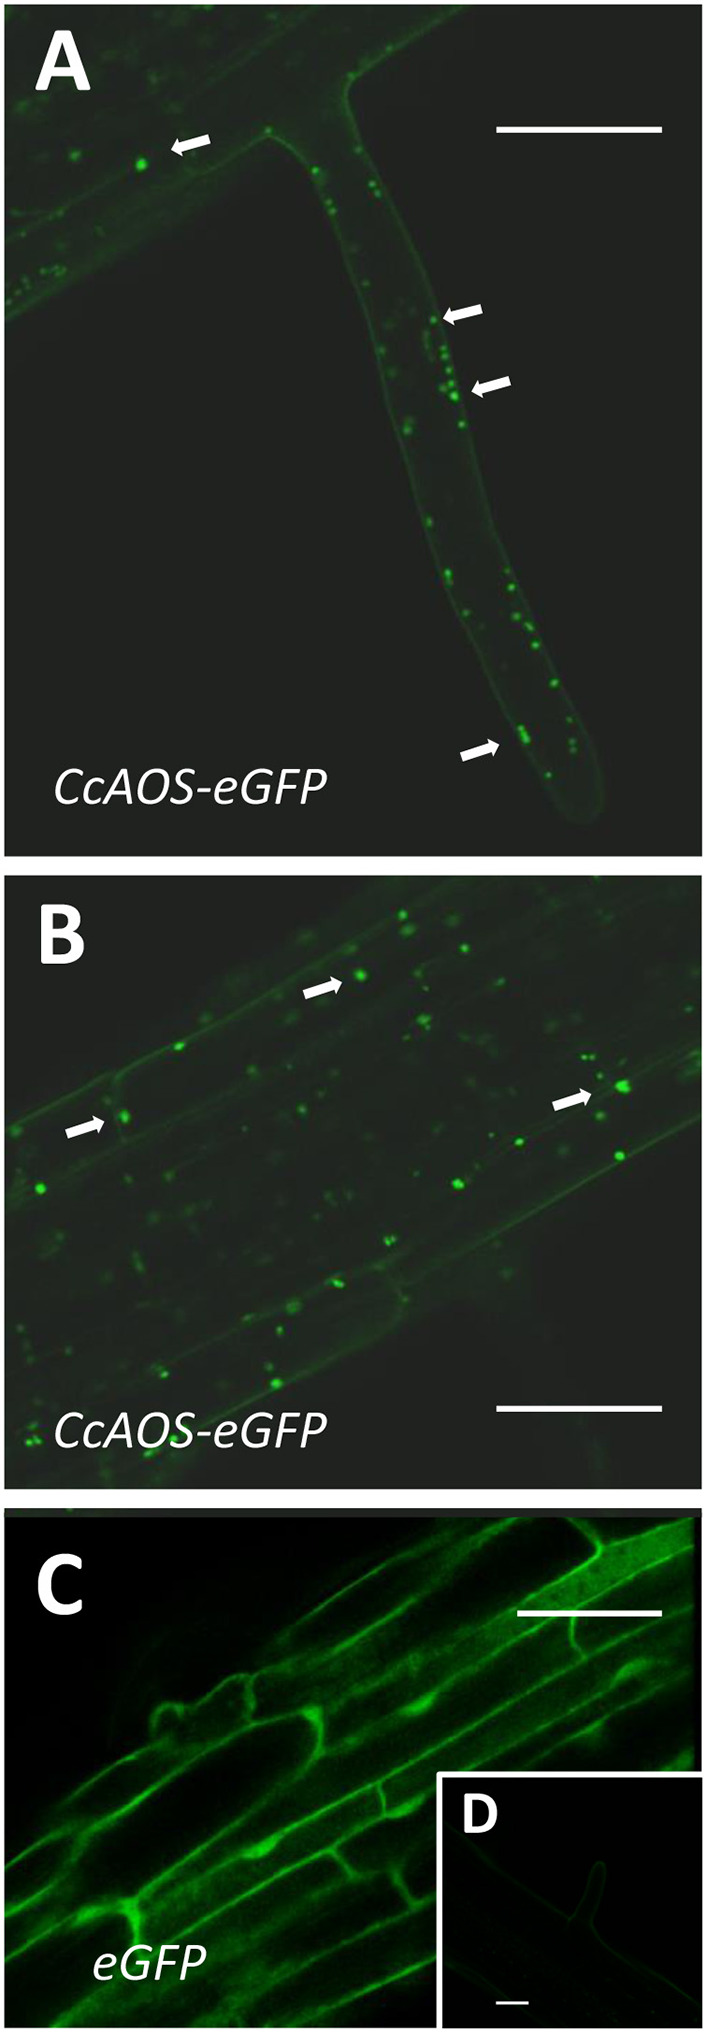
Figure 3.

Sub-cellular localization of stable CcAOS-eGFP expression in roots of A. thaliana. Images (from line CcAOS3) are representative of the three transgenic lines. Scale Bars = 30 μm. (A,B) CcAOS-eGFP expression in root hairs (A) and cortical tissue (B) of the primary root. Fluorescence accumulates in plastids (arrows). (C) Control expression of eGFP. (D) Non-transformed cortical tissue.
