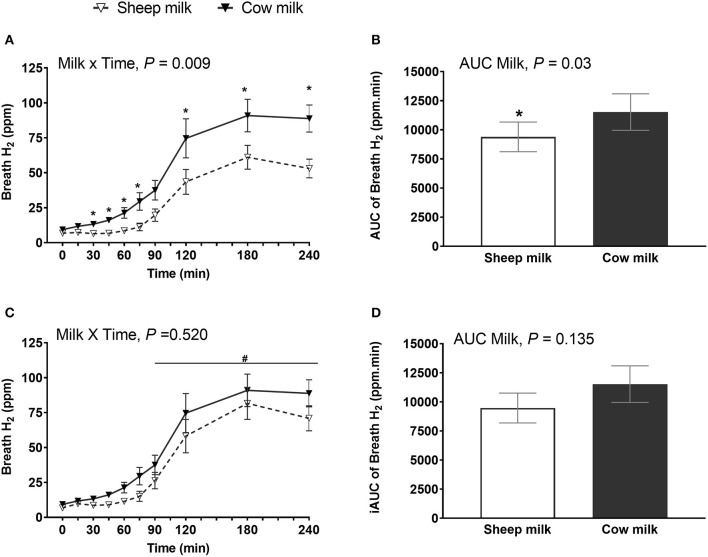
Figure 2.
Breath hydrogen following sheep milk and cow milk (n = 25, after removal of outliers) at multiple time points (A,C) and 4-h incremental iAUC (B,D), before (A,B) and after lactose adjustment (C,D) i.e., considering equal lactose content in both SM and CM. Values are presented as means ± SEM. Data for multiple time points (A,C) was compared by repeated measures general linear model with milk and time compared within-subject and iAUC (B,D) was compared using Students paired t-test. Prior to lactose adjustment (A,B) there was significant milk x time interaction, P = 0.013 and iAUC, P = 0.015. After lactose adjustment (C,D), there was no milk x time interaction, P = 0.069 and iAUC, P = 0.131. * denotes P < 0.05, indicated timepoints were different between the milks after post-hoc correction. and iAUC was different between the milks. There was a significant time effect (C), P < 0.001. #denotes indicated time points were significantly different from baseline.

