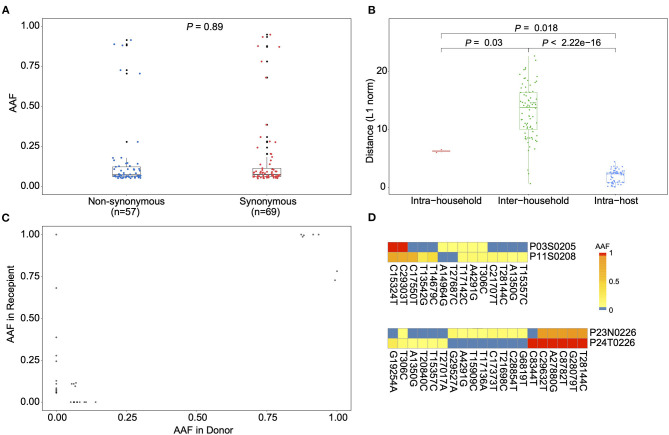
Figure 2.
Allele frequency changes of transmission pairs. (A) Box plots showing the alternative allele frequency (AAF) distribution of synonymous and non-synonymous intra-host variants. Each dot indicates the median AAF of each iSNV sites of samples from same patient. (B) Box plots representing the L1-norm distance distribution among sample pairs. Each dot represents the genetic distance between each sample pair. (C) The AAF of donor iSNVs in transmission pairs. Allele frequencies under 5% and over 95% were adjusted to 0% and 1, respectively. (D) Heatmap representing the alternative allele frequencies (AAFs) of consensus and intra-host single nucleotide variants (iSNVs) of the two transmission pairs.

