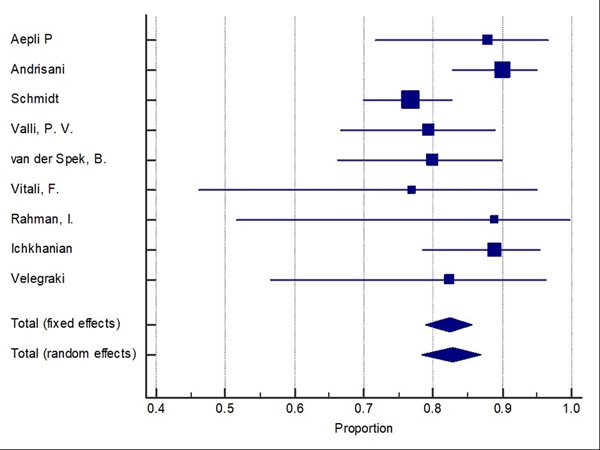
Figure 4:
Forest plot for complete resection (R0) of Full thickness resection device (FTRD). Size of the square is proportional to the precision of the study-specific effect estimates, and the bars indicate the corresponding 95% (Confidence Interval) CIs. The diamond is placed on the summary correlation coefficient of the observational studies, and the width indicates the corresponding 95% CI.

