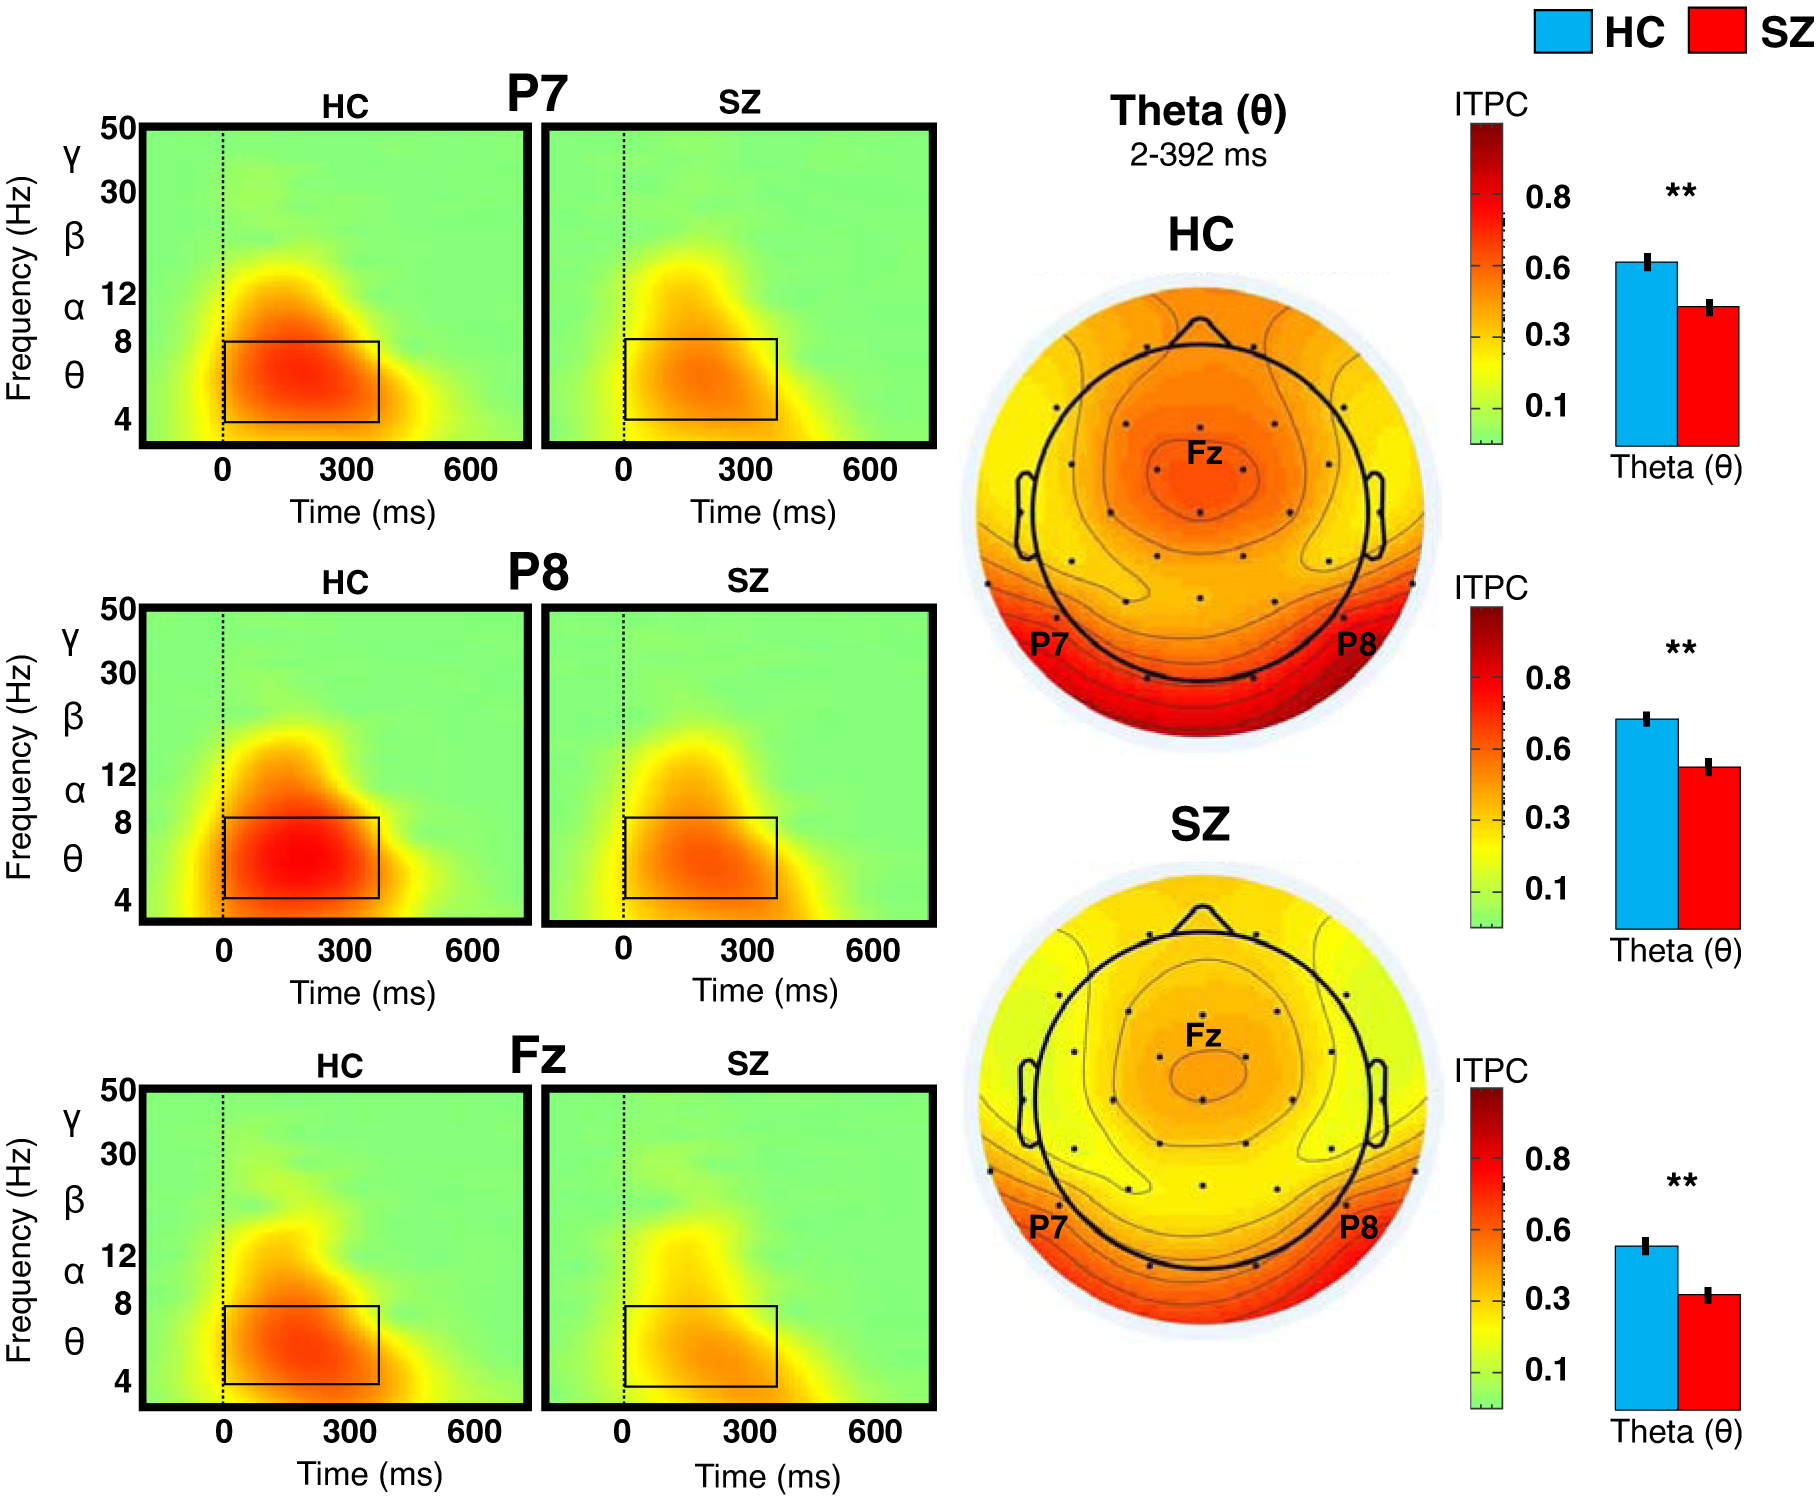
Figure 2. Inter-trial phase consistency (ITPC) at bilateral posterior and midline anterior sites.

The plots on the left show the ITPC of theta activity at P7, P8, and Fz for healthy controls (HC) and schizophrenia (SZ). Topographies in the center of the figure indicate mean theta ITPC within the indicated time window. The bar graphs to the right show (post-hoc) group differences in theta ITPC at each site; vertical lines indicate standard errors. **p<0.01.
