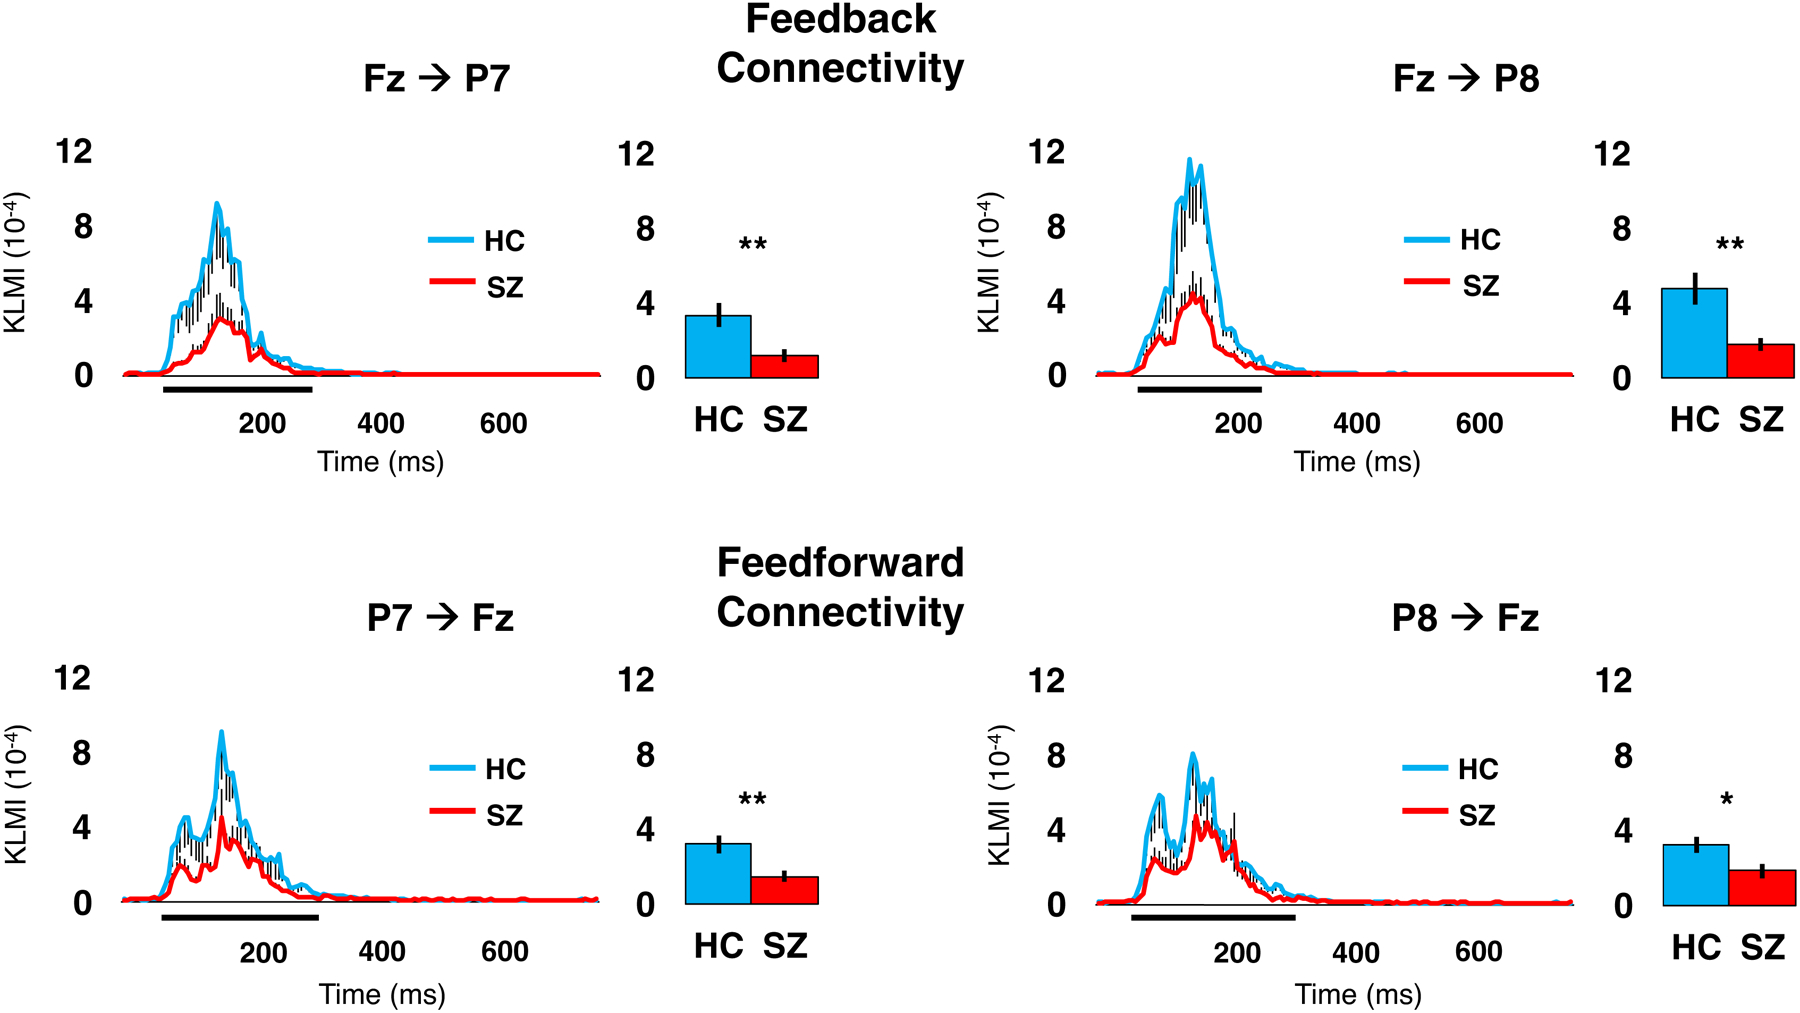
Figure 3. Cross-frequency coupling (CFC) between bilateral posterior (P7/P8) and midline anterior (Fz) sites.

For each site pairing, the line graph illustrates the Kullback-Leibler Modulation Index (KLMI) value at each time point, which indicates the covariance between theta phase at the site of origin and gamma amplitude at the modulated site; black vertical lines indicate standard errors. The thick black horizontal lines directly below the x-axis indicate the time window used to extract KLMI values for group comparisons (results in bar graphs). *p<0.05. ** p<0.01.
