
Figure 2.
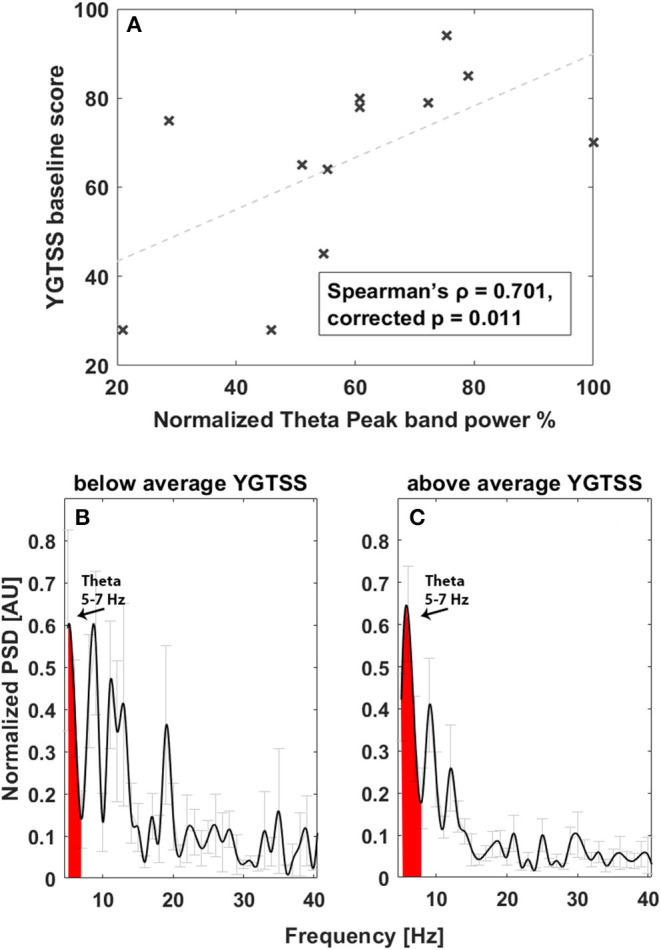
Correlation between tic severity and LFP power in the 5–7-Hz band at baseline. (A) Linear correlation results. The x-axis represents normalized theta (5–7 Hz) peak power; the y-axis represents the YGTSS baseline score. The dashed line represents the linear fit. Light gray bars represent the standard error. (B) Average power spectrum in the acute experimental settings in patients with YGTSS score below the average. The x-axis is the frequency (Hz), the y-axis is the normalized power spectral density (PSD, arbitrary unit), and light gray bars represent the standard error. (C) Average power spectrum in the acute experimental settings in patients with YGTSS score above the average. The x-axis is the frequency (Hz), the y-axis is the normalized power spectral density (PSD, arbitrary unit), and light gray bars represent the standard error.