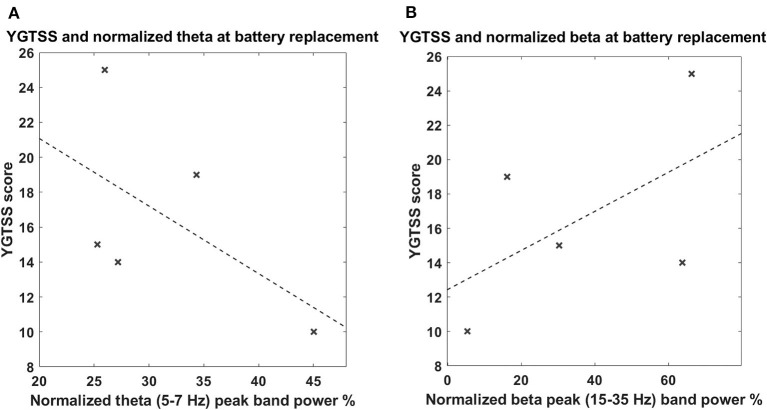
Figure 3.
(A) Correlation between tic severity and LFP power in the 5–7-Hz band in the chronic setting. The x-axis represents the normalized theta (5–7 Hz) peak power; the y-axis represents the YGTSS score at the battery replacement. The dashed line represents the linear fit. (B) Correlation between tic severity and LFP power in the 13–35-Hz (beta) band in the chronic setting. The x-axis represents the normalized beta (13–35 Hz) peak power; the y-axis represent the YGTSS score at the battery replacement. The dashed line represents the linear fit. The correlations were not significant.

