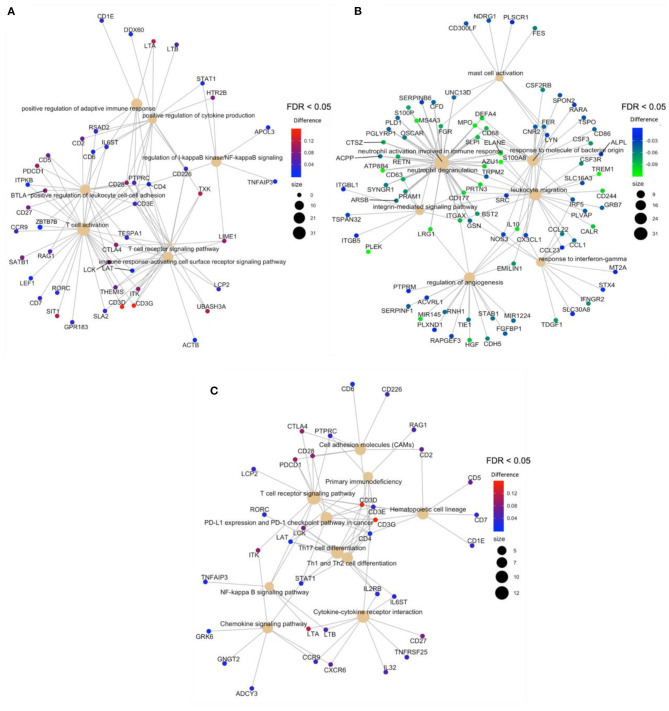
Figure 4.
Gene-concept network (cnetplot) of overlapping DMRs. It shows the enriched concepts, obtained with an FDR cut-off of 0.05 (GO biological processes or KEGG pathways) linked to the DMRs involved in each concept, and the relation between them when genes are involved in more than one process. The size of the concept nodes depends on the gene count involved in that pathway or process, while the color of the gene nodes depends on their methylation level according to the displayed color gradient. (A) Cnetplots of GO terms of hypermethylated regions in neonatal sepsis, (B) GO terms of hypomethylated regions in neonatal sepsis, and (C). KEGG pathways of hypermethylated regions.

