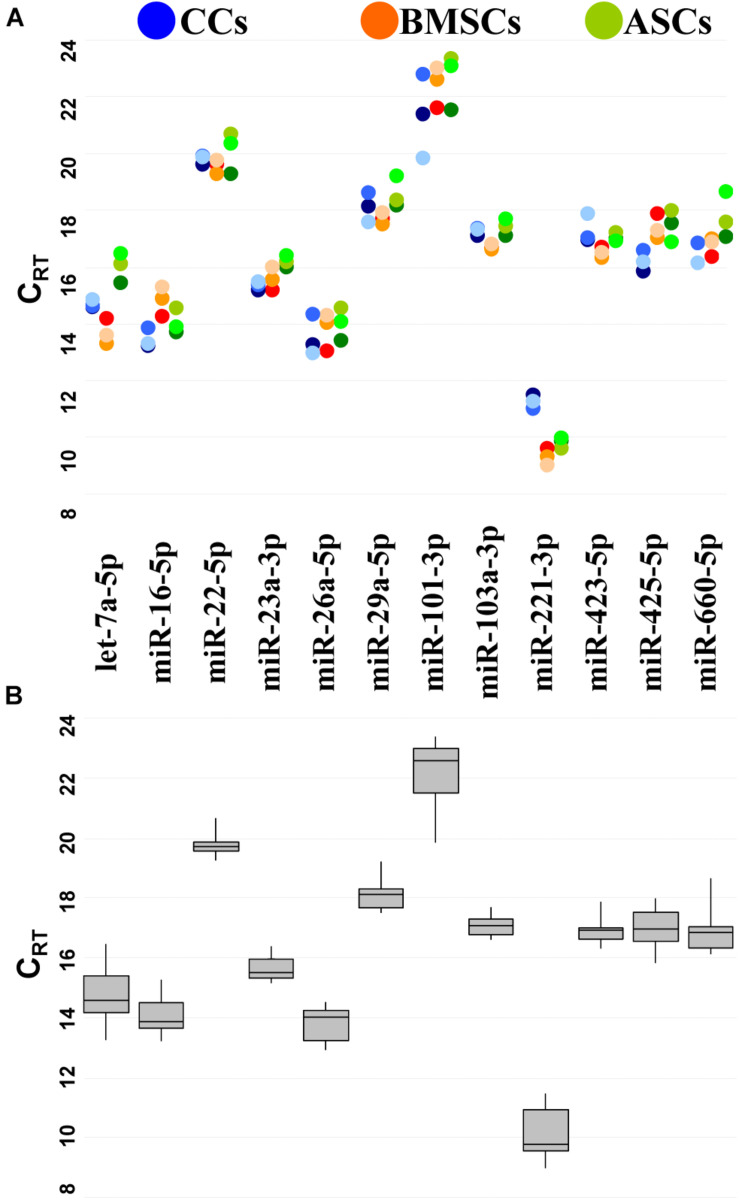
FIGURE 2.
Expression of candidate RG miRNAs in CC-, BMSC-, and ASC-EVs. (A) CRT values for miRNA RGs in different donors. Color from dark to light stands for donors 1–3, respectively. (B) The box plot graphs of the CRT values for each RG, regardless of the donor difference, illustrate the interquartile range (box) and median. The whisker plot depicts the range of the values.

