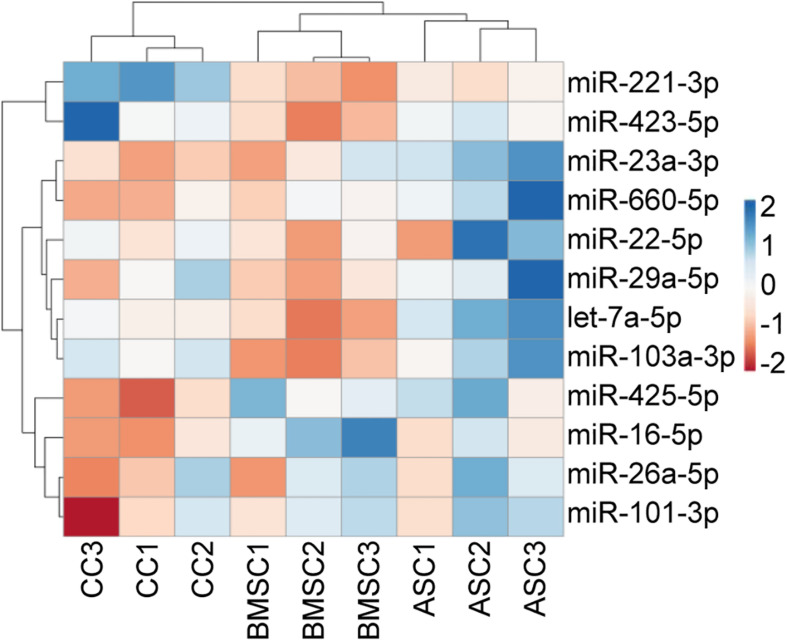
FIGURE 3.
Unsupervised hierarchical clustering for the miRNA RG CRT values. In the dendrogram, each row represents a miRNA, and each column represents a sample. The sample clustering tree is shown at the top. The color scale shown in the map illustrates the relative expression levels of miRNAs across all samples: red shades represent high expression levels (low CRT), and blue shades represent low expression levels (high CRT).

