FIGURE 7.
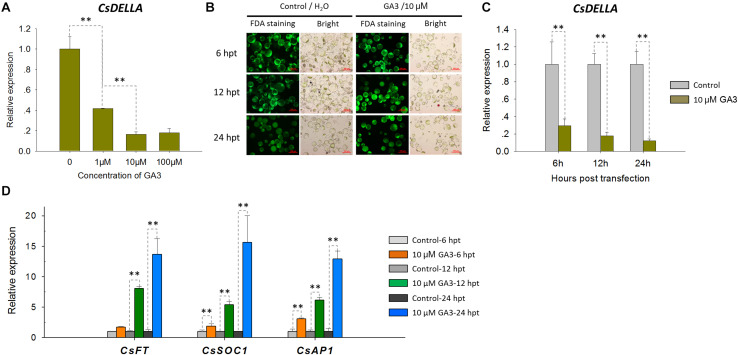
Expression analysis of CsDELLA, CsFT, CsSOC1, and CsAP1 genes in response to GA3 induction with qRT-PCR. (A) Relative expression levels of the CsDELLA gene induced by different concentrations of GA3 were measured with qRT-PCR. (B) Viability test of Cymbidium protoplasts treated with GA3 using FDA staining. (C) Relative expression levels of the CsDELLA gene induced by 10 μM GA3 were measured by qRT-PCR. (D) Relative expression levels of CsFT, CsSOC1, and CsAP1 genes in response to GA3 induction by qRT-PCR. Y-axes indicate the relative expression levels; significant difference was assessed by Mann–Whitney U-test and indicated by asterisks; single asterisk (*) represents p ≤ 0.05, double asterisk (**) represents p ≤ 0.01; data are expressed as the mean of three biological replicates, with error bars indicating the SD values.

