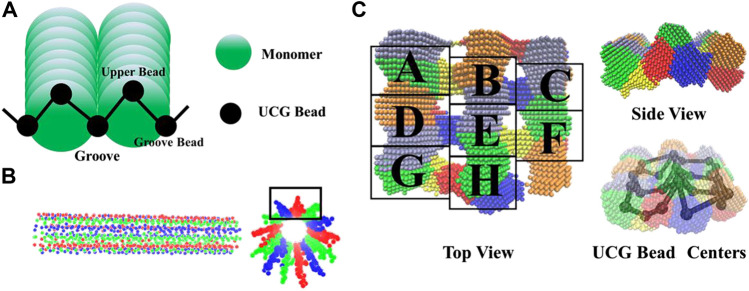
FIGURE 4.
(A) An illustration of the minimal number of UCG beads required for maintaining the grooves of microtubule. (B) The transverse and longitude views of the built models. (C) Zoomed top and side views of the density map of 8 adjacent tubulins, labeled with the upper cases A-H. The different colors denote the density regions which are clustered into the UCG beads, with the corresponding UCG bead centers shown.

