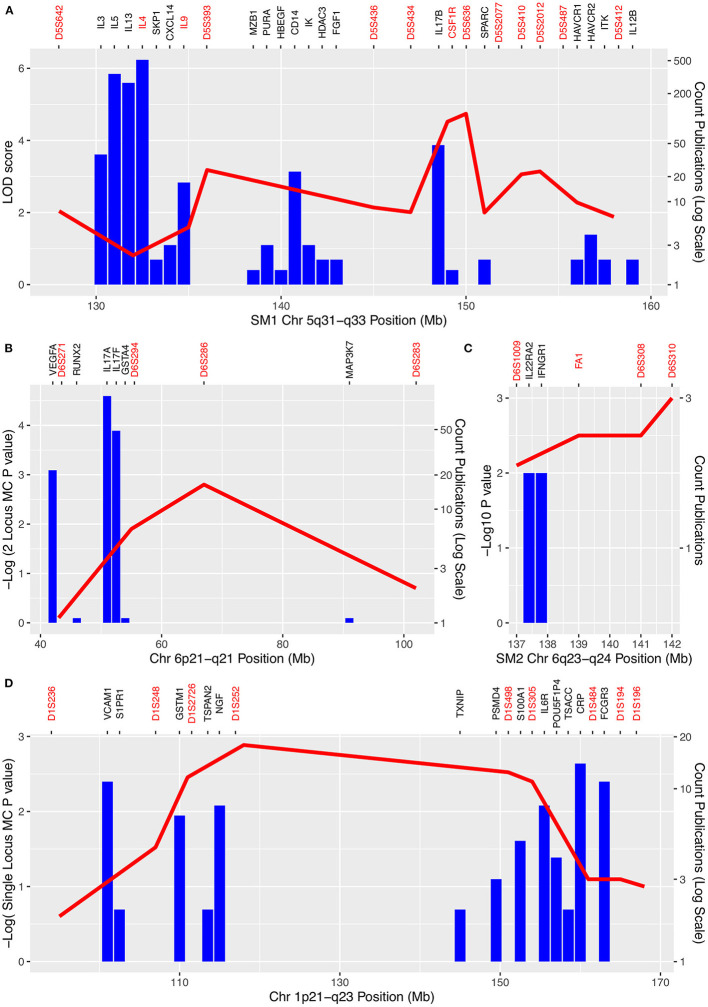
Figure 2.
Schistosomiasis QTL and numbers of publications mentioning each gene in each QTL regions. (A) SM1 region 5q31-q33; (B) 6p21-q21; (C) SM2 6q23-q24; (D) 1p21-q23. Negative log p-values for associations between markers and schistosomiasis are shown on the left-hand axis. Counts of publications which mention both schistosomiasis and genes in the QTL are shown by the blue columns and on a log scale on the right-hand y axis. Markers used in mapping are shown in red on the top axis (including genes used as markers). Genes for which there was only one publication are omitted for clarity and positions of genes and markers have been adjusted by up to 1Mb for clarity. Note the cluster of Th2 cytokine genes (IL3, IL4, IL5, IL9, IL13) in SM1 with large numbers of publications between 131 and 135 Mb but low LOD scores. However, in a reanalysis of the same data using weighted pairwise correlations the peak of the QTL shifted toward this cytokine cluster (69).

