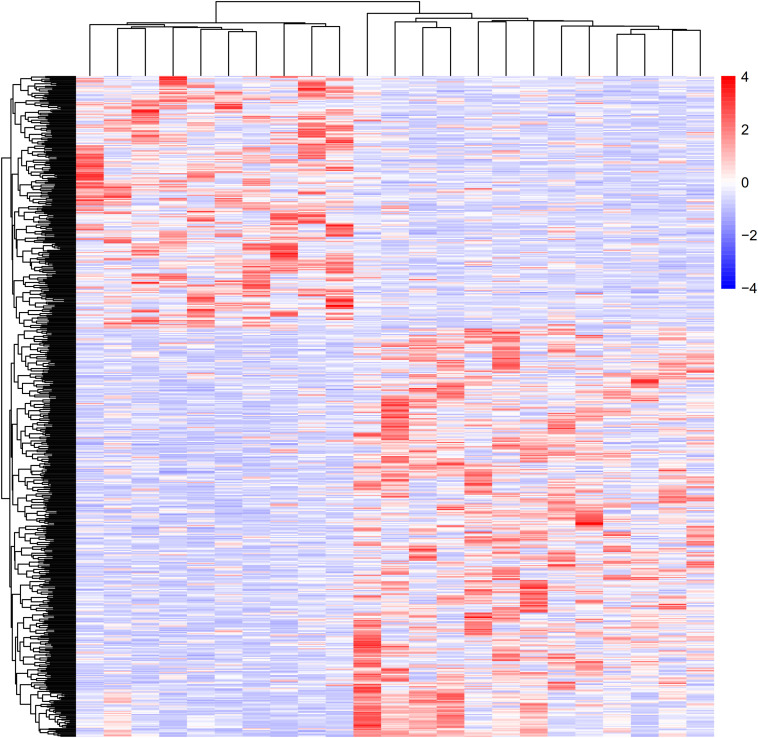
FIGURE 1.
Heat map and cluster dendrogram of DEGs. To determine and analyze the DEGs, NCBI GEO was applied to acquire GSE6088. A total of 3,361 DEGs were at a significant level in atherosclerosis samples compared with normal samples (P < 0.01). Red represents increased genes, and blue decreased genes.

