Figure 8.

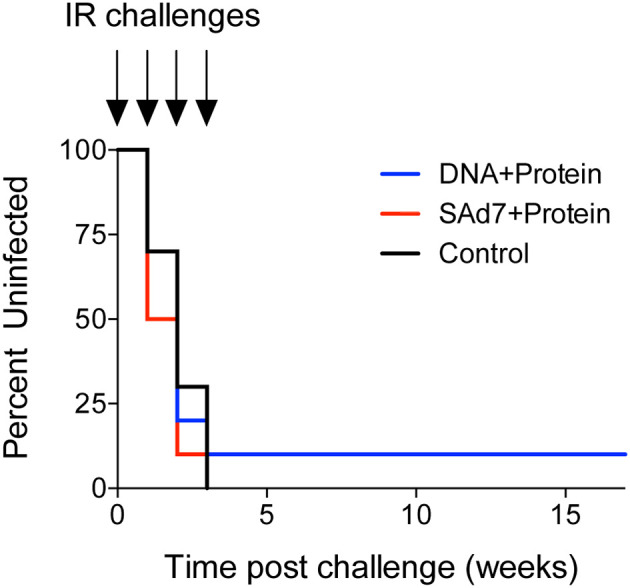
Onset of infection analysis. Modified Kaplan-Meier curve showing the % controllers in each experimental group over the observation period (time post challenge in weeks) based on plasma viral RNA loads.

Onset of infection analysis. Modified Kaplan-Meier curve showing the % controllers in each experimental group over the observation period (time post challenge in weeks) based on plasma viral RNA loads.