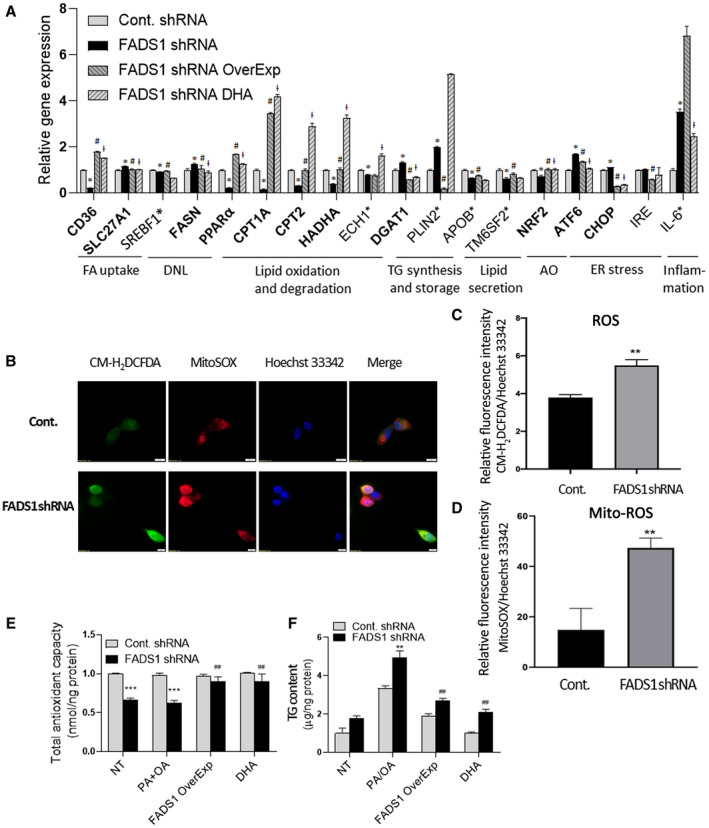
FIG. 3.

Reversal of the effects of FADS1‐KD by FADS1 OverExp or DHA treatment in HepG2 cells. (A) mRNA expression of marker genes in control cells, FADS1‐KD cells, FADS1‐KD cells with FADS1 overexpression, and FADS1‐KD cells treated with DHA (25 μM). Cells were incubated in regular media with vehicle or DHA treatment for 24 hours. Shown here are genes significantly (*P < 0.05) altered in the FADS1‐KD cells as compared with the control cells, which are also reversed by both FADS1 overexpression and DHA treatment (gene names in bold), significantly altered in FADS1‐KD but reversed by either FADS1 overexpression (# P < 0.05) or DHA treatment (ƚ P < 0.05) (gene names labeled with asterisk). (B) Assessment of ROS production in HepG2 control and FADS1‐KD cells with CM‐H2DCFDA (general oxidative stress indicator) and MitoSOX Red (mitochondrial ROS indicator). Hoechst 33342 was used for staining the nuclei. (C,D) Quantification of cellular ROS and mitochondrial ROS level. (E) Total antioxidant levels measured by a colorimetric assay indexed by the conversion of Cu2+ to Cu+ in FADS1‐KD and control HepG2 cells treated with vehicle (NT) or medium containing PA/OA (all other three groups) for 24 hours. (F) Total TG levels in FADS1‐KD and control HepG2 cells in vehicle (NT) and medium level of PA/OA supplemented medium (other three groups) for 24 hours. *P < 0.05, **P < 0.01, or ***P < 0.001 as compared with the control shRNA cells; # P < 0.05, ## P < 0.01, or ### P < 0.001 as compared with the FADS1‐KD cells treated with PA/OA. Data of a representative experiment (in triplicates) of three independent performances are shown. Abbreviations: AO, antioxidant; FA, fatty acid; IRE, inositol requiring enzyme; mito‐ROS, mitochondrial ROS.
