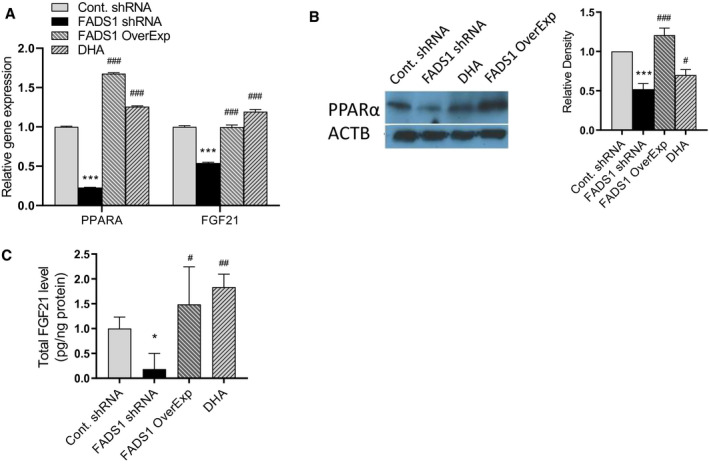
FIG. 4.

Expression of PPAR‐α and FGF21 following manipulations of FADS1 function. (A) Quantitative PCR mRNA expression of PPAR‐α and FGF21 in control, FADS1‐KD, FADS1‐KD with FADS1 overexpression, and FADS1‐KD with DHA‐treated HepG2 cells. Cells were treated with medium level of PA/OA for 24 hours. Protein level of PPAR‐α (western blot) in the cells (B) and secreted FGF21 (ELISA) (C) in collected medium after treated under the same condition as in (A). *P < 0.05, **P < 0.01, or ***P < 0.001 as compared with the control group; # P < 0.05, ## P < 0.01, or ### P < 0.001 as compared with the FADS1‐KD cells treated with PA/OA. Data of a representative experiment (in triplicates) of three independent performances are shown. Abbreviation: ACTB, actin beta.
