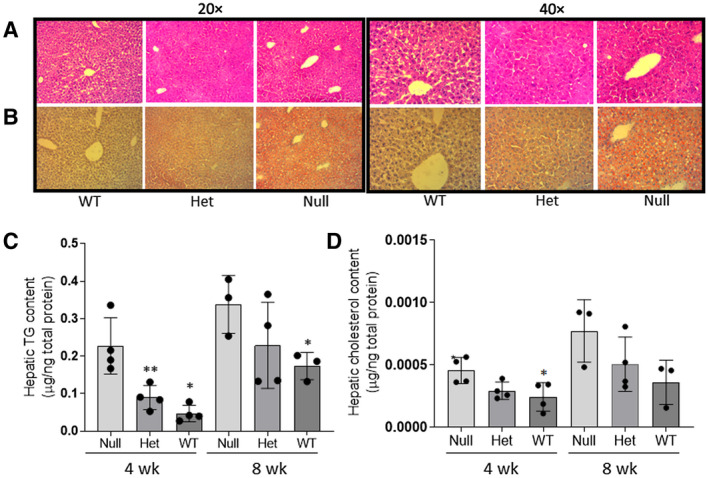
FIG. 7.

Effect of Fads1‐KO on liver histology (A), lipid droplet formation (B), total hepatic TG (C), and total cholesterol levels (D). Liver histology was demonstrated with hematoxylin and eosin staining, and lipids droplets are shown with ORO staining. Both were from mice fed with HFD for 4 weeks, and the tissue section was visualized at ×20 magnification for total TG levels in FADS1 null, Het, and WT mice fed with HFD for 4 and 8 weeks. *P < 0.05 or **P < 0.01 as compared with the WT mice. (C,D) Data were generated through a single experiment in triplicates. Abbreviation: wk, weeks.
