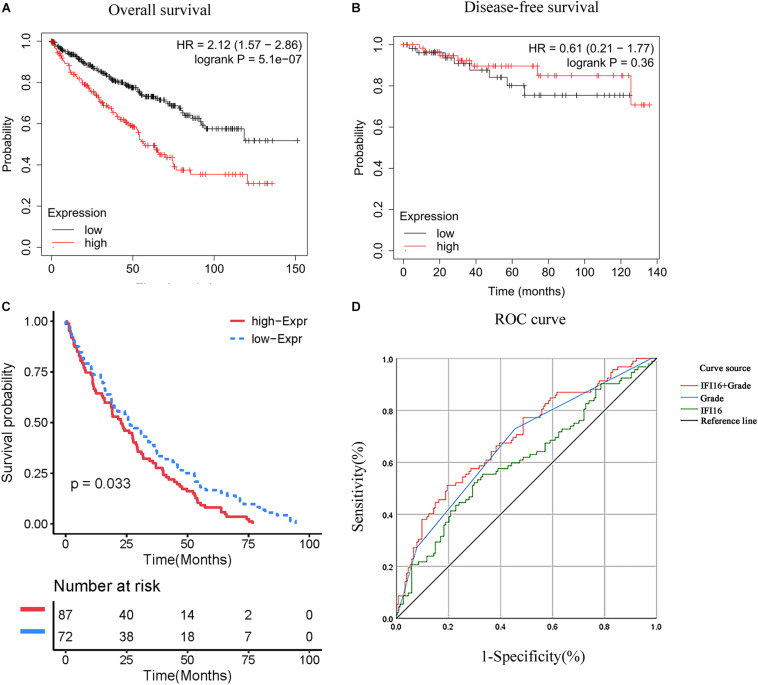
FIGURE 2.
Correlation between IFI16 expression and prognosis. (A) Correlation between IFI16 expression and OS, as shown by Kaplan-Meier curve. (B) Correlation between IFI16 expression and DFS, as shown by Kaplan-Meier curve. (C) Correlation between IFI16 expression and OS (ICGC database). (D) Use of IFI16 expression and histopathological grade to evaluate the predictive efficiency of ccRCC patients using a ROC curve.

