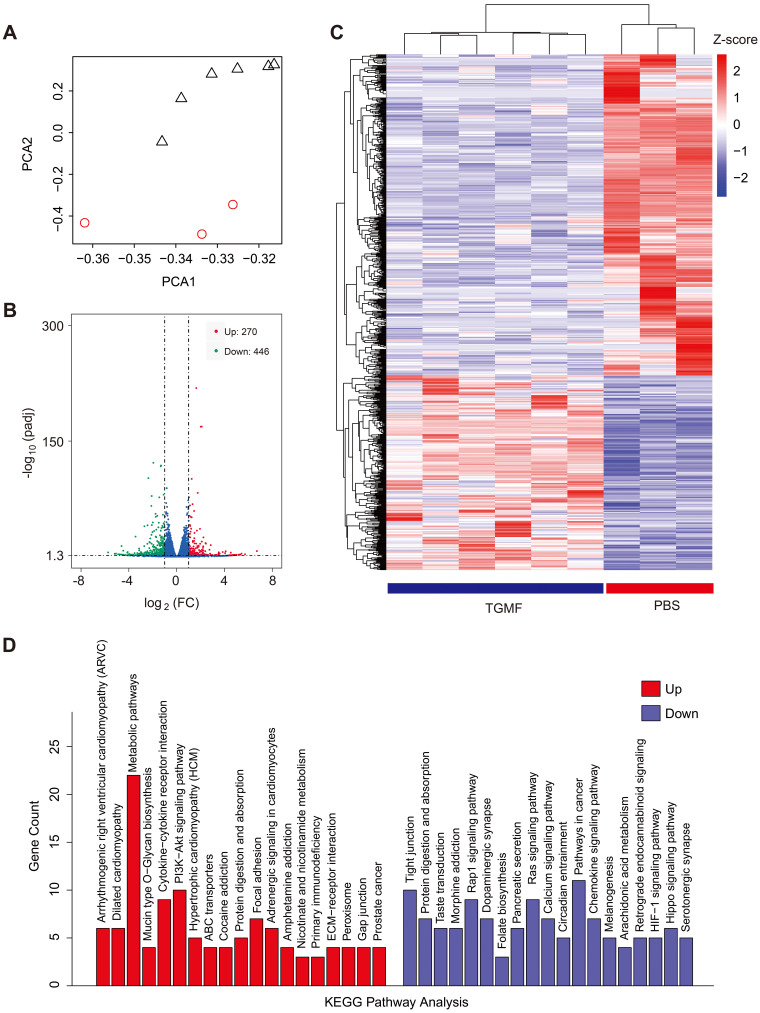
Figure 5.
(A) PCA of the transcriptome of RNA-seq data from HeLa cells with PBS or TGMF treatment. (B) Volcano plot of the transcriptome of RNA-seq data from HeLa cells with PBS or TGMF treatment. (C) Differential gene expression heat maps for RNA-seq data of HeLa cell treated with PBS or TGMF. (D) The top 19 pathway terms enriching DEGs in Kyoto Encyclopedia of Genes and Genomes (KEGG) analysis.

