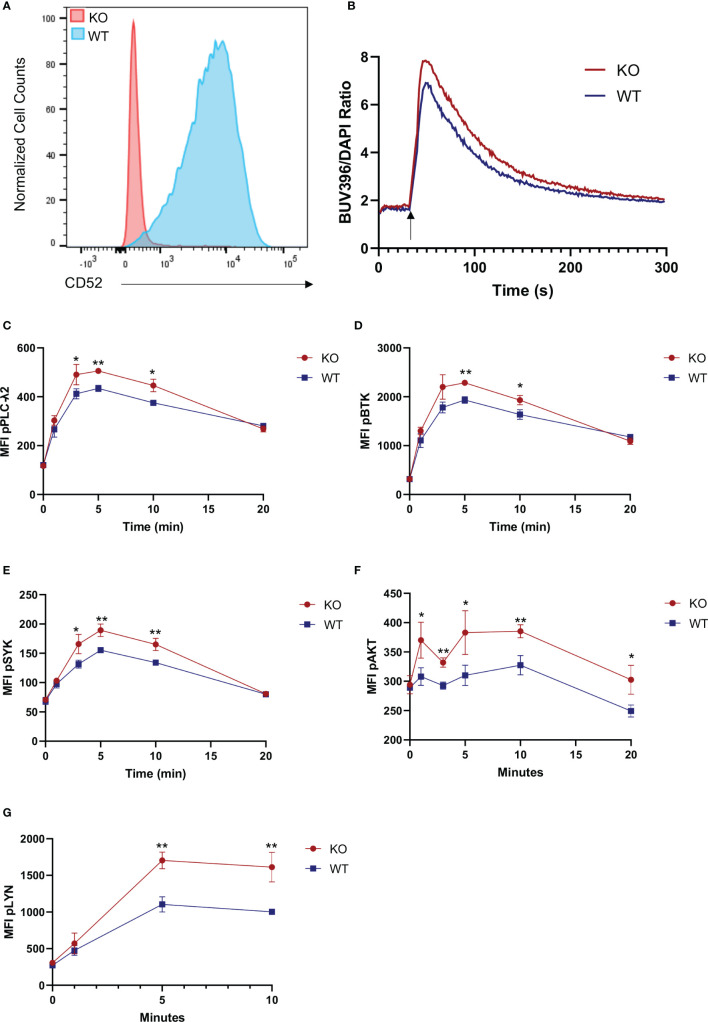
Figure 3.
Surface CD52 expression inhibits B cell receptor signaling. (A) Flow cytometry data, showing a representative histogram of CD52 expression on wild-type process control JeKo-1 cells and CD52 CRISPR knockout cells. (B) Calcium flux measurement in CD52-KO and WT cells before and after stimulation with anti-IgM (25 µg/ml)(indicated time points). (C–G) Phospho-kinetics of (C) phospho-PLCγ2, (D) phospho-BTK, (E) phospho-SYK, (F) phospho-AKT and (G) phospho-Lyn in WT and KO cells stimulated with anti-IgM (10 µg/ml). Data in (B, C–G) representative of at least n = 2 independent experiments. *p < 0.05, **p < 0.01, according to unpaired t-test.

