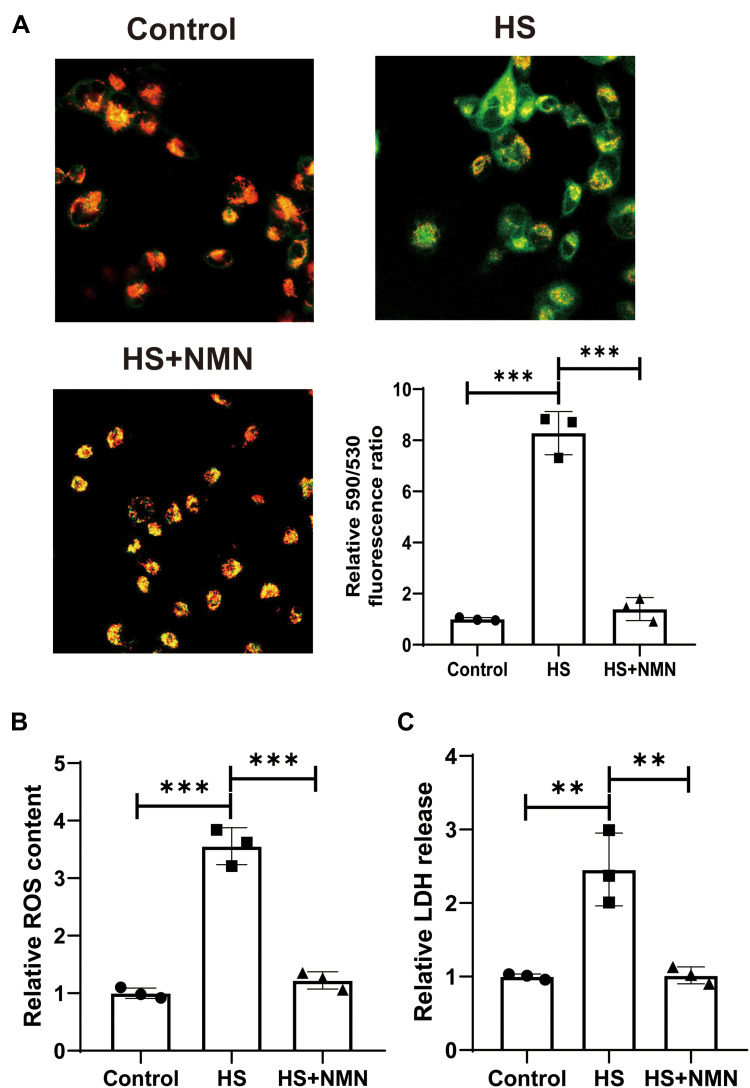
Figure 3.
NMN alleviated HS-induced MMP, intracellular ROS and LDH release increase in CEC. (A) The MMP in control group, HS status and NMN-treated HS group using JC-1 staining, n=3, data presented as mean ± SD. One-way ANOVA with SNK multiple comparisons test. ***P<0.001. (B) The relative intracellular ROS content in control group, HS status and NMN-treated HS group, n=3, data presented as mean ± SD. One-way ANOVA with SNK multiple comparisons test. ***P<0.001. (C) The relative LDH release in control group, HS status and NMN-treated HS group, n=3, data presented as mean ± SD. One-way ANOVA with SNK multiple comparisons test. **P<0.01.

