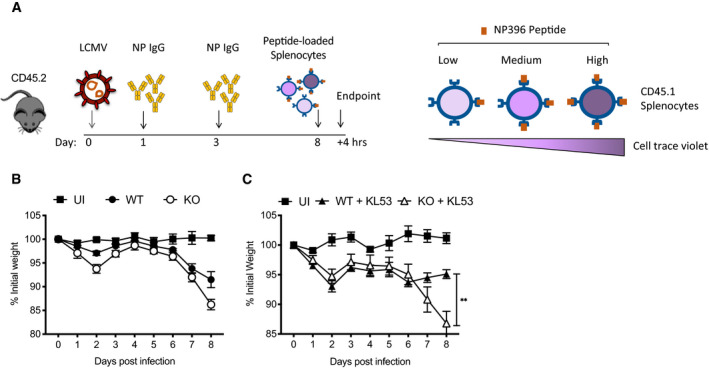
Figure EV2. Experimental detail of in vivo killing assay.

- Timeline of in vivo killing protocol, and diagram of pulse‐labelling of CD45.1 splenocytes with different concentrations of N396 peptide and staining with cell trace violet.
- Weights of WT and KO mice infected with LCMV which received pulsed‐labelled splenocytes 8dpi for in vivo killing experiment shown in Fig 4A.
- Weights of WT and KO mice infected with LCMV then passively transferred with KL53 that received pulsed‐labelled splenocytes 8dpi for in vivo killing experiment shown in Fig 4B.
Data information: All data are presented as mean with standard error (n = 6). **P < 0.01, unpaired t‐test.
