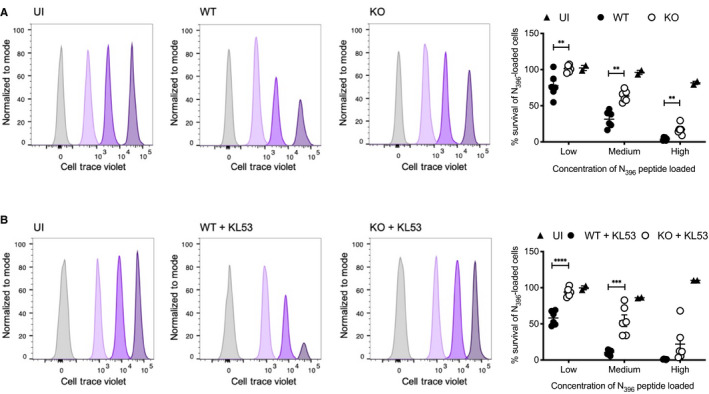
Figure 4. N‐specific CTLs induced by anti‐N antibodies and TRIM21 drive potent in vivo cell killing.

- Splenocytes from uninfected CD45.1 mice, either pulsed with 3 concentrations of N peptide and cell trace violet (CTV) or unlabelled control cells, were transfused intravenously into WT and KO mice (CD45.2) that had been infected with 0.5 × 10⁵ FFU LCMV 8 days earlier. After 3 h, spleens from recipient mice were harvested and the proportion of CTV‐labelled CD45.1 cells was analysed by flow cytometry. Histograms from single representative uninfected (UI), WT and KO mice are presented, showing the proportion of CD45.1 cells remaining for each of the labelled fractions normalised to mode. Summary data from all individual mice in the same experiment are presented in associated scatter plot, showing the mean ± standard error.
- Labelled splenocytes as for (A) were transfused into WT and KO mice that had been infected with LCMV 8 days earlier and received mAb KL53 on days 1 and 3pi. Flow cytometry histograms from single representative mice of each genotype. Summary data from all mice in the experiment are presented, showing the mean ± standard error.
Data information: Horizontal bars on each graph correspond to the mean ± standard error, **P < 0.01, ***P < 0.001, unpaired t‐test.
