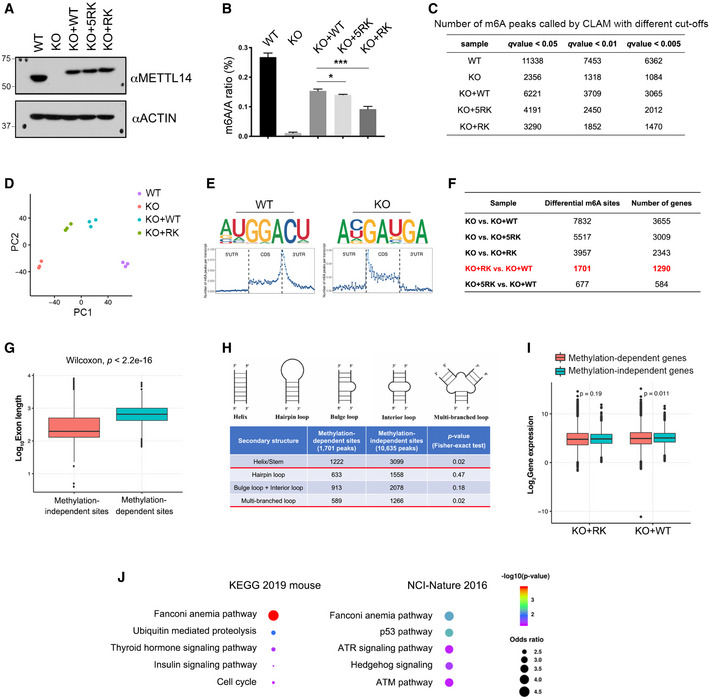
Figure EV4. MeRIP‐seq (m6A‐seq) analysis of mESCs expressing WT and arginine methylation‐deficient METTL14.

- Three isogenic mESC lines were established by re‐expressing WT (KO + WT), 5RK (KO + 5RK), and 13RK (KO + RK) mutant METTL14 in Mettl14 KO mESCs through lentivirus transduction. The expression of METTL14 in these cell lines was detected by Western blot analysis using an anti‐METTL14 antibody. ACTIN was used as a loading control.
- LC‐MS/MS was performed to quantify m6A levels (presented as the m6A/A ratio) in WT, Mettl14 KO, KO + WT, KO + 5RK, and KO + RK mESCs. The total RNA was extracted using the TRIzol reagent, and the poly(A) mRNA was purified for LC‐MS/MS analysis. Data from three biological replicates were analyzed by Student’s t‐test and shown as mean ± SD. *P < 0.05; ***P < 0.001.
- Summary of the numbers of m6A peaks in WT, Mettl14 KO, KO + WT, KO + 5RK, and KO + RK mESCs using different q‐value cutoffs.
- Principal component analysis (PCA) plot of m6A peaks in WT, Mettl14 KO, KO + WT, and KO + RK mESCs, each with three biological replicates. PC1 and PC2 are the top two principle components that explained the highest percentage of the variance.
- Sequence motifs of m6A‐enriched regions in WT and Mettl14 KO mESCs (upper panels). Topological distribution of normalized m6A peaks across the 5′UTR, CDS, and 3′UTR of mRNAs (lower panels).
- Summary of the numbers of differential m6A peaks and corresponding numbers of genes for each pair of comparison among all established mESC cell lines. The differential m6A sites and the number of genes harboring these sites compared between KO + RK and KO + WT mESCs were highlighted in red.
- Length comparison between internal exons harboring METTL14 arginine methylation‐independent and ‐dependent m6A sites. Statistical analysis was performed using the Wilcoxon test to measure the median difference between the two groups.
- Secondary structure prediction of RNA sequences harboring METTL14 arginine methylation‐dependent and ‐independent m6A sites. Statistical analysis was performed using Fisher’s exact test.
- Gene expression level comparison of genes harboring METTL14 arginine methylation‐independent and ‐dependent m6A sites in KO + RK and KO + WT mESCs. Statistical analysis was performed using the Wilcoxon test.
- GO pathway analysis using EnrichR (Kuleshov et al, 2016) reveals that genes harboring METTL14 arginine methylation‐dependent m6A peaks are enriched for the Fanconi anemia pathway. Examples of analysis using two‐pathway interaction annotation databases (KEGG 2019 mouse and NCI‐Nature 2016) are shown. Statistical analysis was performed using Fisher exact test, as defined in EnrichR.
Data information: In both (G) and (I), data are obtained from three biological replicates. The lower and upper hinges of the boxes are the 25th and 75th percentiles, and the central band corresponds to median. The upper whisker defines the value no larger than 1.5*distance between the first and third quartiles from the upper hinge, while the lower whisker defines the value no smaller than 1.5*distance between the first and third quartiles from the lower hinge.
Source data are available online for this figure.
