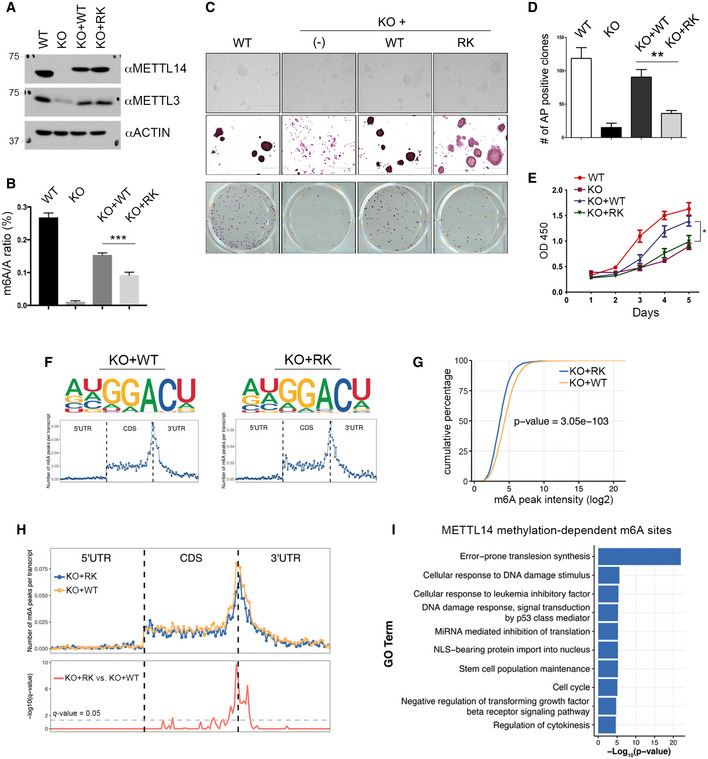
Figure 5. Analysis of METTL14 arginine methylation‐dependent m6A sites.

- Generation of isogenic mESC lines expressing WT and arginine methylation‐deficient mutant (RK) METTL14. Mettl14 KO mESCs were transfected with Flag‐tagged WT or RK mutant METTL14 using a lentivirus expression system. The expression of METTL14 and METTL3 in these cells was detected by Western blot analysis using anti‐METTL14 and anti‐METTL3 antibodies. ACTIN was used as a loading control.
- m6A levels are reduced in mESCs expressing arginine methylation‐deficient (RK) mutant METTL14. The mRNA purified from WT, Mettl14 KO, KO + WT, and KO + RK mESCs was subjected to LC‐MS/MS analysis to quantify m6A levels (presented as the m6A/A ratio).
- Morphology and alkaline phosphatase (AP) staining of mESCs expressing WT, Mettl14 KO, KO + WT, and KO + RK METTL14. Scale bar: 400 µm.
- Quantification of AP‐positive clones in (C).
- Proliferation of mESCs expressing WT, Mettl14 KO, KO + WT, and KO + RK METTL14 over a 5‐day period. Each point represents the average of three independent replicates, and error bars represent standard deviation (SD).
- Sequence motifs of m6A‐enriched regions in KO + WT and KO + RK mESCs (upper panels). Topological distribution of normalized m6A peaks across the 5′UTR, CDS, and 3′UTR of mRNAs (lower panels).
- Cumulative distribution of log2 m6A peak intensity in KO + WT and KO + RK mESCs. Statistical analysis was performed using the Wilcoxon test to measure the median difference of peak intensities between the two groups.
- Overlay of m6A distributions across the 5′UTR, CDS, and 3′UTR of mRNAs in KO + WT and KO + RK mESCs (upper panel). Statistical analysis of differential m6A peaks in KO + RK versus KO + WT mESCs (lower panel). The y‐axis represents the q‐value (−log10). The dashed gray line indicates q‐value = 0.05.
- Gene Ontology (GO) analysis of genes harboring METTL14 arginine methylation‐dependent m6A sites. Statistical analysis was performed using Hypergeometric test. The P‐value for the enrichment of each biological process (GO term) is shown.
Data information: In (B), (D), and (E), data from three independent replicates were analyzed by Student’s t‐test and shown as mean ± SD. *P < 0.05; **P < 0.01, ***P < 0.001.
Source data are available online for this figure.
