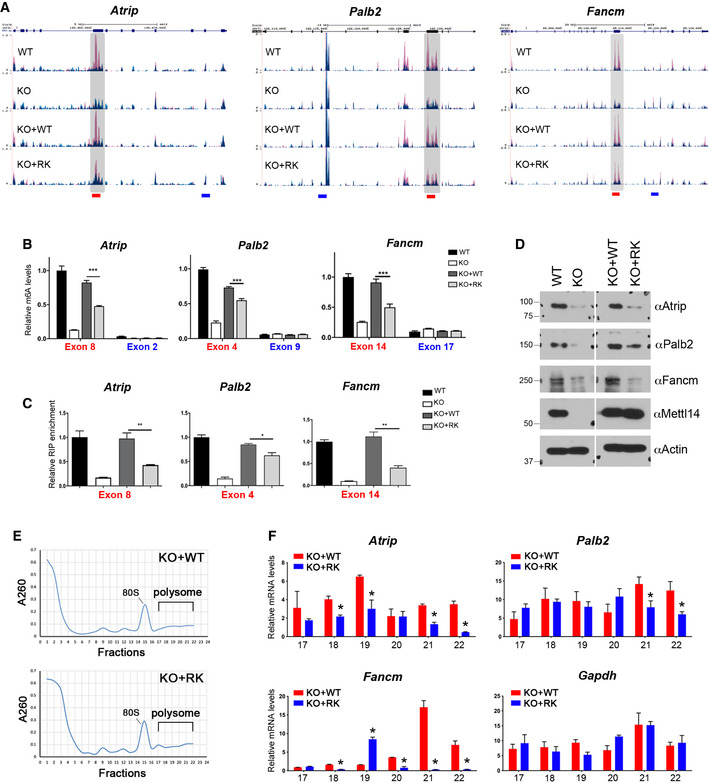
Figure 6. METTL14 arginine methylation‐dependent m6A sites are associated with enhanced translation of DNA repair genes.

- UCSC Genome Browser custom tracks of m6A‐seq reads along the indicated mRNAs in WT, Mettl14 KO, KO + WT, and KO + RK mESCs. The y‐axis represents the normalized number of reads. Blue reads are from non‐immunoprecipitated input libraries, and red reads are from m6A‐IP libraries. Above the custom tracks, the thick blue boxes represent the protein‐coding regions (CDSs), the thin blue boxes represent the untranslated regions (UTRs), and the blue lines represent introns. The bars at the bottom of the custom tracks indicate the amplicon locations for MeRIP (m6A‐IP)‐qPCR assays (B) and METTL14 RIP‐qPCR assays (C) to detect m6A‐positive (red) and negative (blue) regions.
- MeRIP (m6A‐IP)‐qPCR assays were performed for WT, Mettl14 KO, KO + WT, and KO + RK mESCs to validate the MeRIP‐seq results. m6A‐negative regions of the transcripts (blue) were included as negative controls.
- METTL14 RIP‐qPCR assays were performed for WT, Mettl14 KO, KO + WT, and KO + RK mESCs to compare the binding of WT and RK mutant METTL14 to mRNA targets. Primers (red color) that amplify m6A positive regions of the transcripts were used.
- The expression of ICL repair genes is reduced in mESCs expressing arginine methylation‐deficient mutant (RK) METTL14. Total cell lysates from WT, Mettl14 KO, KO + WT, and KO + RK mESCs were subjected to Western blot analysis using the indicated antibodies.
- Polysome profiling was performed for KO + WT and KO + RK mESCs. Whole‐cell extracts were fractionated through centrifugation in a sucrose density gradient. Optical scans (OD260) of the collected fractions are shown.
- Quantification of ribosome‐bound mRNA for the indicated genes from individual fractions (as in (E)), relative to the amount of the total mRNA in all fractions. Gapdh was included as a negative control.
Data information: In (B), (C), and (F), data from three independent replicates were analyzed by Student’s t‐test and shown as mean ± SD. *P < 0.05; **P < 0.01, ***P < 0.001.
Source data are available online for this figure.
