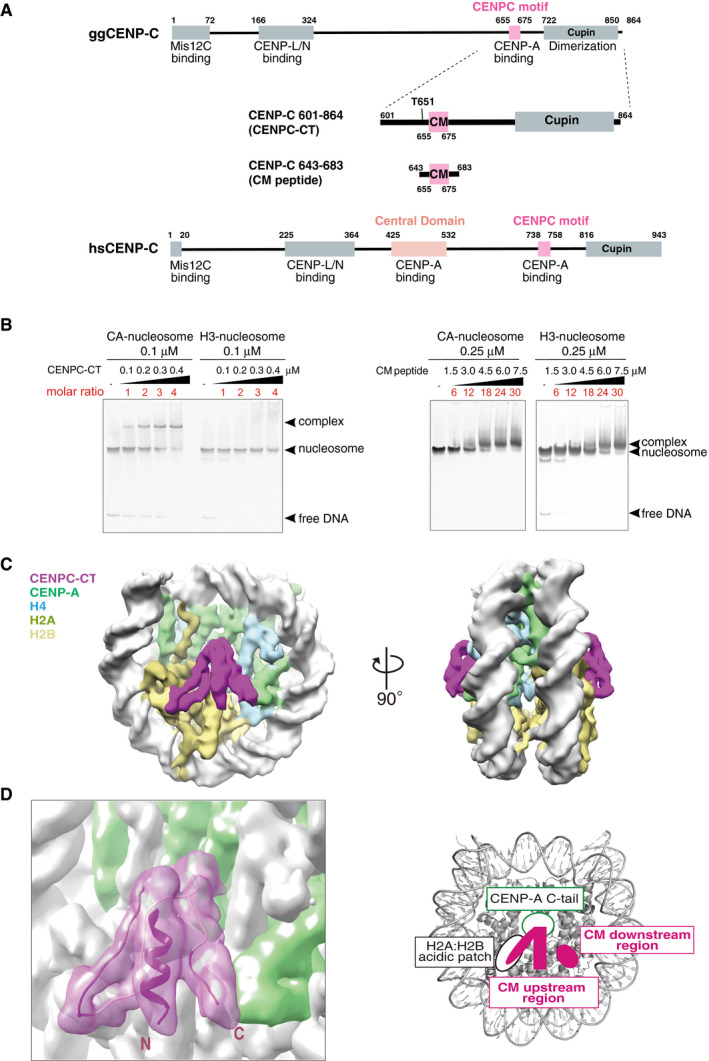
Figure 1. CENP‐A nucleosome binding of the C‐terminal fragment of CENP‐C.

- Schematic diagram of the functional regions of chicken and human CENP‐C molecules. The canonical CENPC motifs for CENP‐A binding (aa 655‐675 in chicken CNEP‐C, aa 738‐758 in human CENP‐C) are colored pink. Another CENP‐A binding region (central domain) in human CENP‐C is colored light pink. The C‐terminal fragment (aa 601‐864: CENPC‐CT) and the CENPC motif‐containing peptide (aa 643‐683; CM peptide) derived from chicken CNEP‐C, which were used for the in vitro CENP‐A nucleosome‐binding assay, are diagrammed.
- Electrophoretic mobility shift assay (EMSA) examination of the binding affinity of CENPC‐CT and CM peptide to a CENP‐A nucleosome. Binding to a canonical H3 nucleosome was also examined using EMSA.
- Cryo‐EM density map of the CENP‐A nucleosome in complex with CENPC‐CT (CA‐CCCT complex) at a 4.5 Å resolution. The side views of the CA‐CCCT complex along the two‐fold axis are shown. The density corresponding to each molecule in the complex is color‐coded, as indicated in the figure.
- Cryo‐EM structure of the CENP‐A nucleosome‐binding region of CENPC‐CT. The left panel shows the cartoon representation of the structure of CENPC‐CT bound to the CENP‐A nucleosome with the cryo‐EM density map. The densities derived from CENPC‐CT and CENP‐A molecules are color‐coded in magenta and pale green, respectively. The functional elements in the CENP‐A nucleosome‐binding region of CENPC‐CT are depicted in the right panel. In addition to the CENPC motif, which recognizes the H2A/H2B acidic patch and the CENP‐A C‐terminal tail (C‐tail), the CM upstream and CM downstream regions are identified in the CENP‐A bound structure of CENPC‐CT. See also Fig EV2C.
