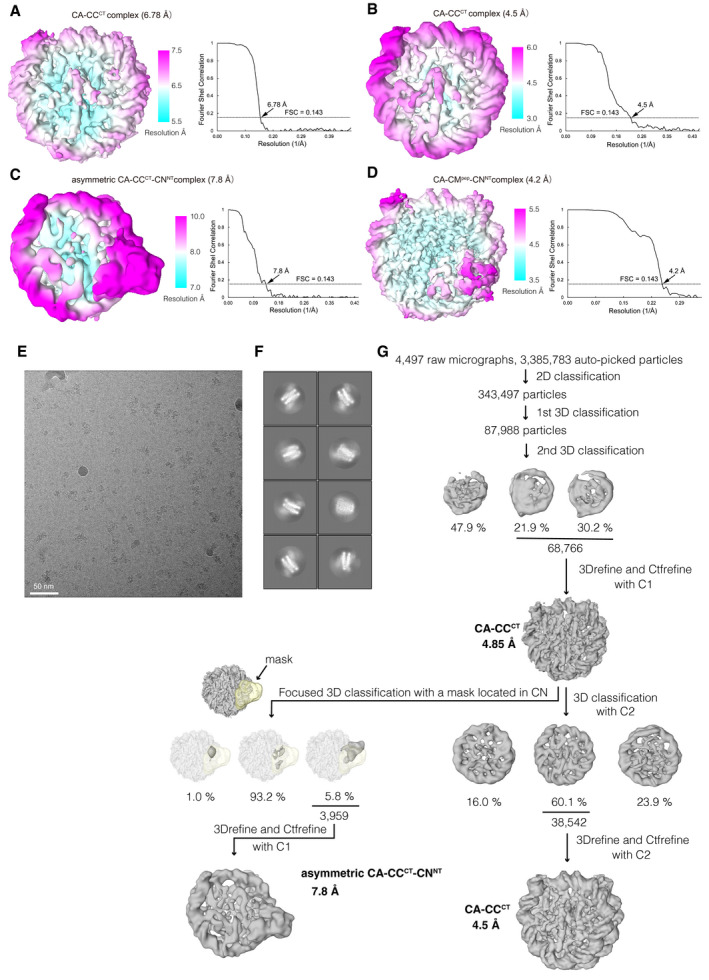
Cryo‐EM density map of the chicken CA‐CCCT complex at a 6.78 Å resolution, colored according to the local resolution estimated by RELION in the left panel. Gold‐standard Fourier shell correlation (FSC) curve of the Cryo‐EM density map is displayed in the right panel. Reported resolution was based on the FSC = 0.143 criterion.
Cryo‐EM density map and FSC curve of the chicken CA‐CCCT complex at a 4.5 Å resolution obtained using the CENP‐A nucleosome + CENPC‐CT + CENPN‐NT sample (major component) are shown as in (A).
Cryo‐EM density map and FSC curve of the asymmetric chicken CA‐CCCT‐CNNT complex at 7.8 Å resolution obtained using CA + CCCT+CNNT sample (minor component) are shown as in (A).
Cryo‐EM density map and FSC curve of the asymmetric chicken CA‐CCpep‐CNNT complex at a 4.2 Å resolution are shown as in (A).
A representative micrograph of the CENP‐A complex with CENPC‐CT and CENPN‐NT.
Representative 2D class averages of the CENP‐A nucleosome + CENPC‐CT + CENPN‐NT sample.
Flow chart showing the image processing pipeline for the cryo‐EM single particle image analysis of the chicken CA‐CCCT complex and asymmetric chicken CA‐CCCT‐CNNT complex.

