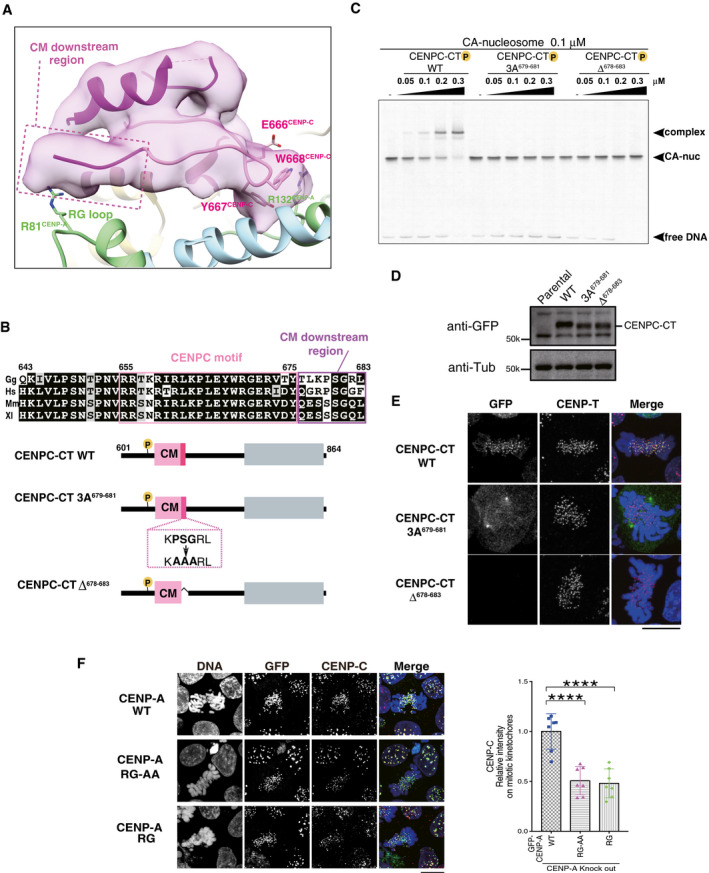
The RG loopCENP‐A binding site of CENPC‐CT is shown. The backbone structure of the CENPC‐CT is presented in a cartoon model, which is colored in magenta, except for the pink canonical CENPC motif (aa 655‐675). The cryo‐EM density map of CENPC‐CT is overlaid on the cartoon model. The CM downstream region beyond Y675CENP‐C is indicated by a dotted box. Key residues involved in binding to the C‐terminal tail of CENP‐A are indicated as stick models. The cartoon models of CENP‐A and histone H4 are shown in pale green and pale blue, respectively.
Alignment of sequences around the CENPC motif region of CENP‐C from various species: Gg, chicken; Hs, human; Mm, mouse; and Xl, frog. The CENPC motif and the CM downstream region are depicted by pink and purple boxes, respectively, in the sequence alignment. Schematic diagram of chicken CENPC‐CT wild‐type (CENPC‐CT WT), CENPC‐CT, in which PSG residues in the CM downstream region were substituted with AAA (CENPC‐CT 3A679‐681), and CENPC‐CT, in which six residues were deleted (CENPC‐CT Δ678‐683), are shown.
EMSA results of the binding affinities of CENPC‐CT WT, CENPC‐CT 3A679‐681, and CENPC‐CT Δ678‐683 to the CENP‐A nucleosome.
Stable expression of GFP‐fused CENPC‐CT and its mutants (shown in (B)) in CENP‐C knockout chicken DT40 cells. α‐Tubulin (Tub) was probed as a loading control. Parental CENP‐C knockout cells (parental) were also examined.
Localization analysis of GFP‐fused CENPC‐CT WT, CENPC‐CT 3A679‐681, and CENPC‐CT Δ678‐683 (green) on the mitotic chromosomes in chicken DT40 cells. CENP‐T (red) was used as a centromere marker. DNA was stained using 4',6‐diamidino‐2‐phenylindole (DAPI; blue). Scale bar indicates 10 μm.
Localization of CENP‐C in CENP‐A knockout DT40 cells stably expressing GFP‐fused chicken CENP‐A WT, RG‐AA, or ∆RG. Scale bar indicates 10 μm. CENP‐C was stained by an anti‐CENP‐C antibody (red), and DNA was stained by DAPI (blue). CENP‐C signals on kinetochores in mitotic cells were quantified in each cell. Bar graph indicates mean ± SD (n = 7; ****, P < 0.0001, unpaired t‐test, two‐tailed).

