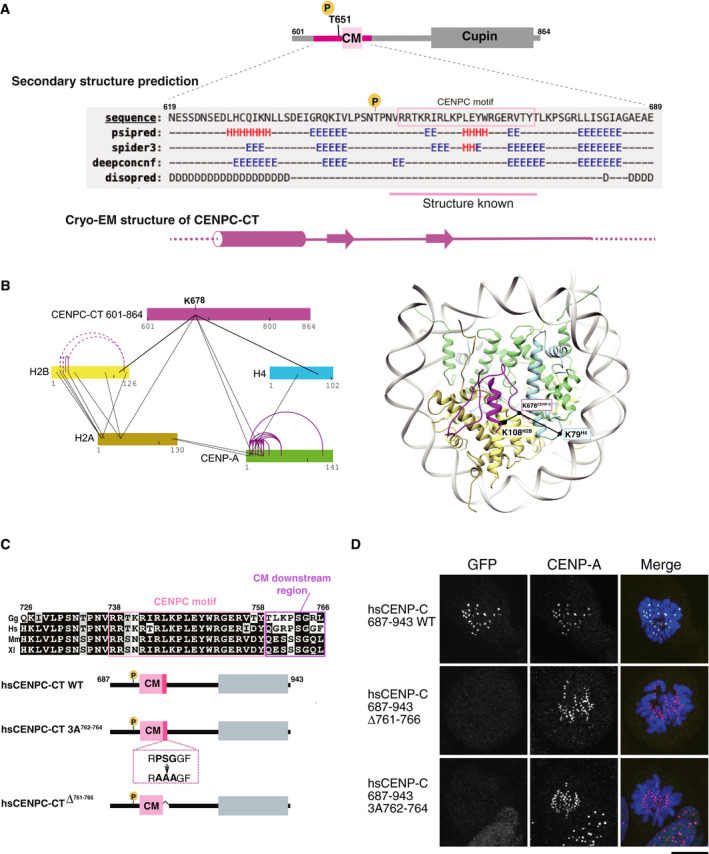
Figure EV4. Association of CENPC‐CT with RG loopCENP‐A .

- Secondary structure prediction of CENPC‐CT. A diagram of chicken CENPC‐CT is shown. The secondary structure of the putative CENP‐A binding region of CENPC‐CT was analyzed by six different programs using a HHpred server https://toolkit.tuebingen.mpg.de/tools/hhpred. Predicted secondary structure elements are indicated by H for helix, E for strand, and D for disordered region. The canonical CENPC motif, with previously determined structure in homologues, is highlighted in pink. A schematic diagram of the cryo‐EM structure of CENPC‐CT is shown at the bottom.
- Crosslinking mass spectroscopy (XL‐MS) interactions depicted in relation to CENPC‐CT and histones, including CENP‐A. Color bars represent protein sequences. Black and purple lines show inter‐ and intra‐protein links, respectively. In the right panel, the crosslinked sites between CENP‐C and histones are indicated on the CA‐CCCT complex structure in which K678CENP‐C was linked with K108H2B and K79H4. Detailed XL‐MS data are presented in Appendix Fig S2.
- Alignment of sequences around the CENPC motif region in various species: Gg, chicken; Hs, human; Mm, mouse, and Xl; frog. The CENPC motif and the CM downstream region are depicted by pink and purple boxes, respectively, in the sequence alignment. The residue numbers of human CENP‐C are indicated. Schematic diagram of human CENPC‐CT wild‐type (CENPC‐CT WT: aa 687‐943) corresponding to chicken CNEPC‐CT used for the cryo‐EM analysis is depicted. The conserved PSG residues (aa 762‐764) in the CM downstream region were substituted with AAA (CENPC‐CT 3A762‐764) and CENPC‐CT in which six residues were deleted (CENPC‐CTΔ761‐766) are shown.
- Localization analysis of GFP‐fused human CENPC‐CT WT and mutants shown in (C) on the mitotic chromosomes in CENP‐C knock out human RPE‐1 cells. CENP‐A was used as a centromere marker. Scale bar indicates 10 μm.
