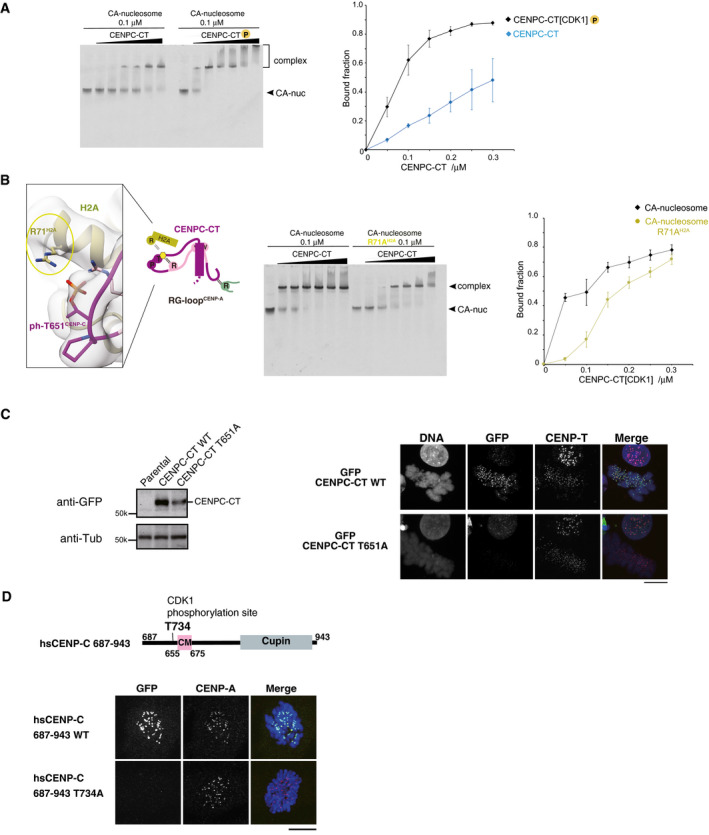
Figure EV5. Stabilization of the CENP‐A nucleosome binding of CENPC‐CT via phosphorylation of T651CENP‐C .

- EMSA was performed to examine the binding affinities of phosphorylated or nonphosphorylated CENPC‐CT (CENPC‐CT[CDK1] or CENPC‐CT). The signal intensities of upper binds (bound fractions) were measured. The graph indicates mean with SD (n = 3).
- Left panel displays a magnified view of the interface between CENPC‐CT and histone H2A in the CENP‐A nucleosome. Arginine 71 of histone H2A (R71H2A) was situated close to the phosphorylated T651CENP‐C in the range of 3.5 to 4.5 Å. Side chains of R71H2A and phosphorylated T651 of CENP‐C (ph‐T651CENP‐C) are indicated in stick model. The middle panel displays results of EMSA performed to examine the significance of the interaction between R71H2A and ph‐T651CENP‐C. Right panel displays quantification of the EMSA results. The graph indicates mean with SD (n = 3).
- Left panel displays the stable expression of GFP‐fused CENPC‐CT or the CDK1 phosphorylation site mutant (CENPC‐CT T651A) in CENP‐C knockout chicken DT40 cells was confirmed by immunoblot analysis. α‐Tubulin (Tub) was probed as a loading control. Parental CENP‐C knockout cells were also analyzed (parental). Right panel displays the results of localization analysis of GFP‐fused CENPC‐CT WT and T651A mutant in CENP‐C knockout chicken DT40 cells. CENP‐T was used as a centromere marker. Scale bar indicates 10 μm.
- Localization analysis of GFP‐fused human CENPC‐CT (687‐943) WT and T734A mutant (equivalent to T651A of chicken CENP‐C) in CENP‐C knockout human RPE1 cells. CENP‐A was used as a centromere marker. Scale bar indicates 10 μm.
