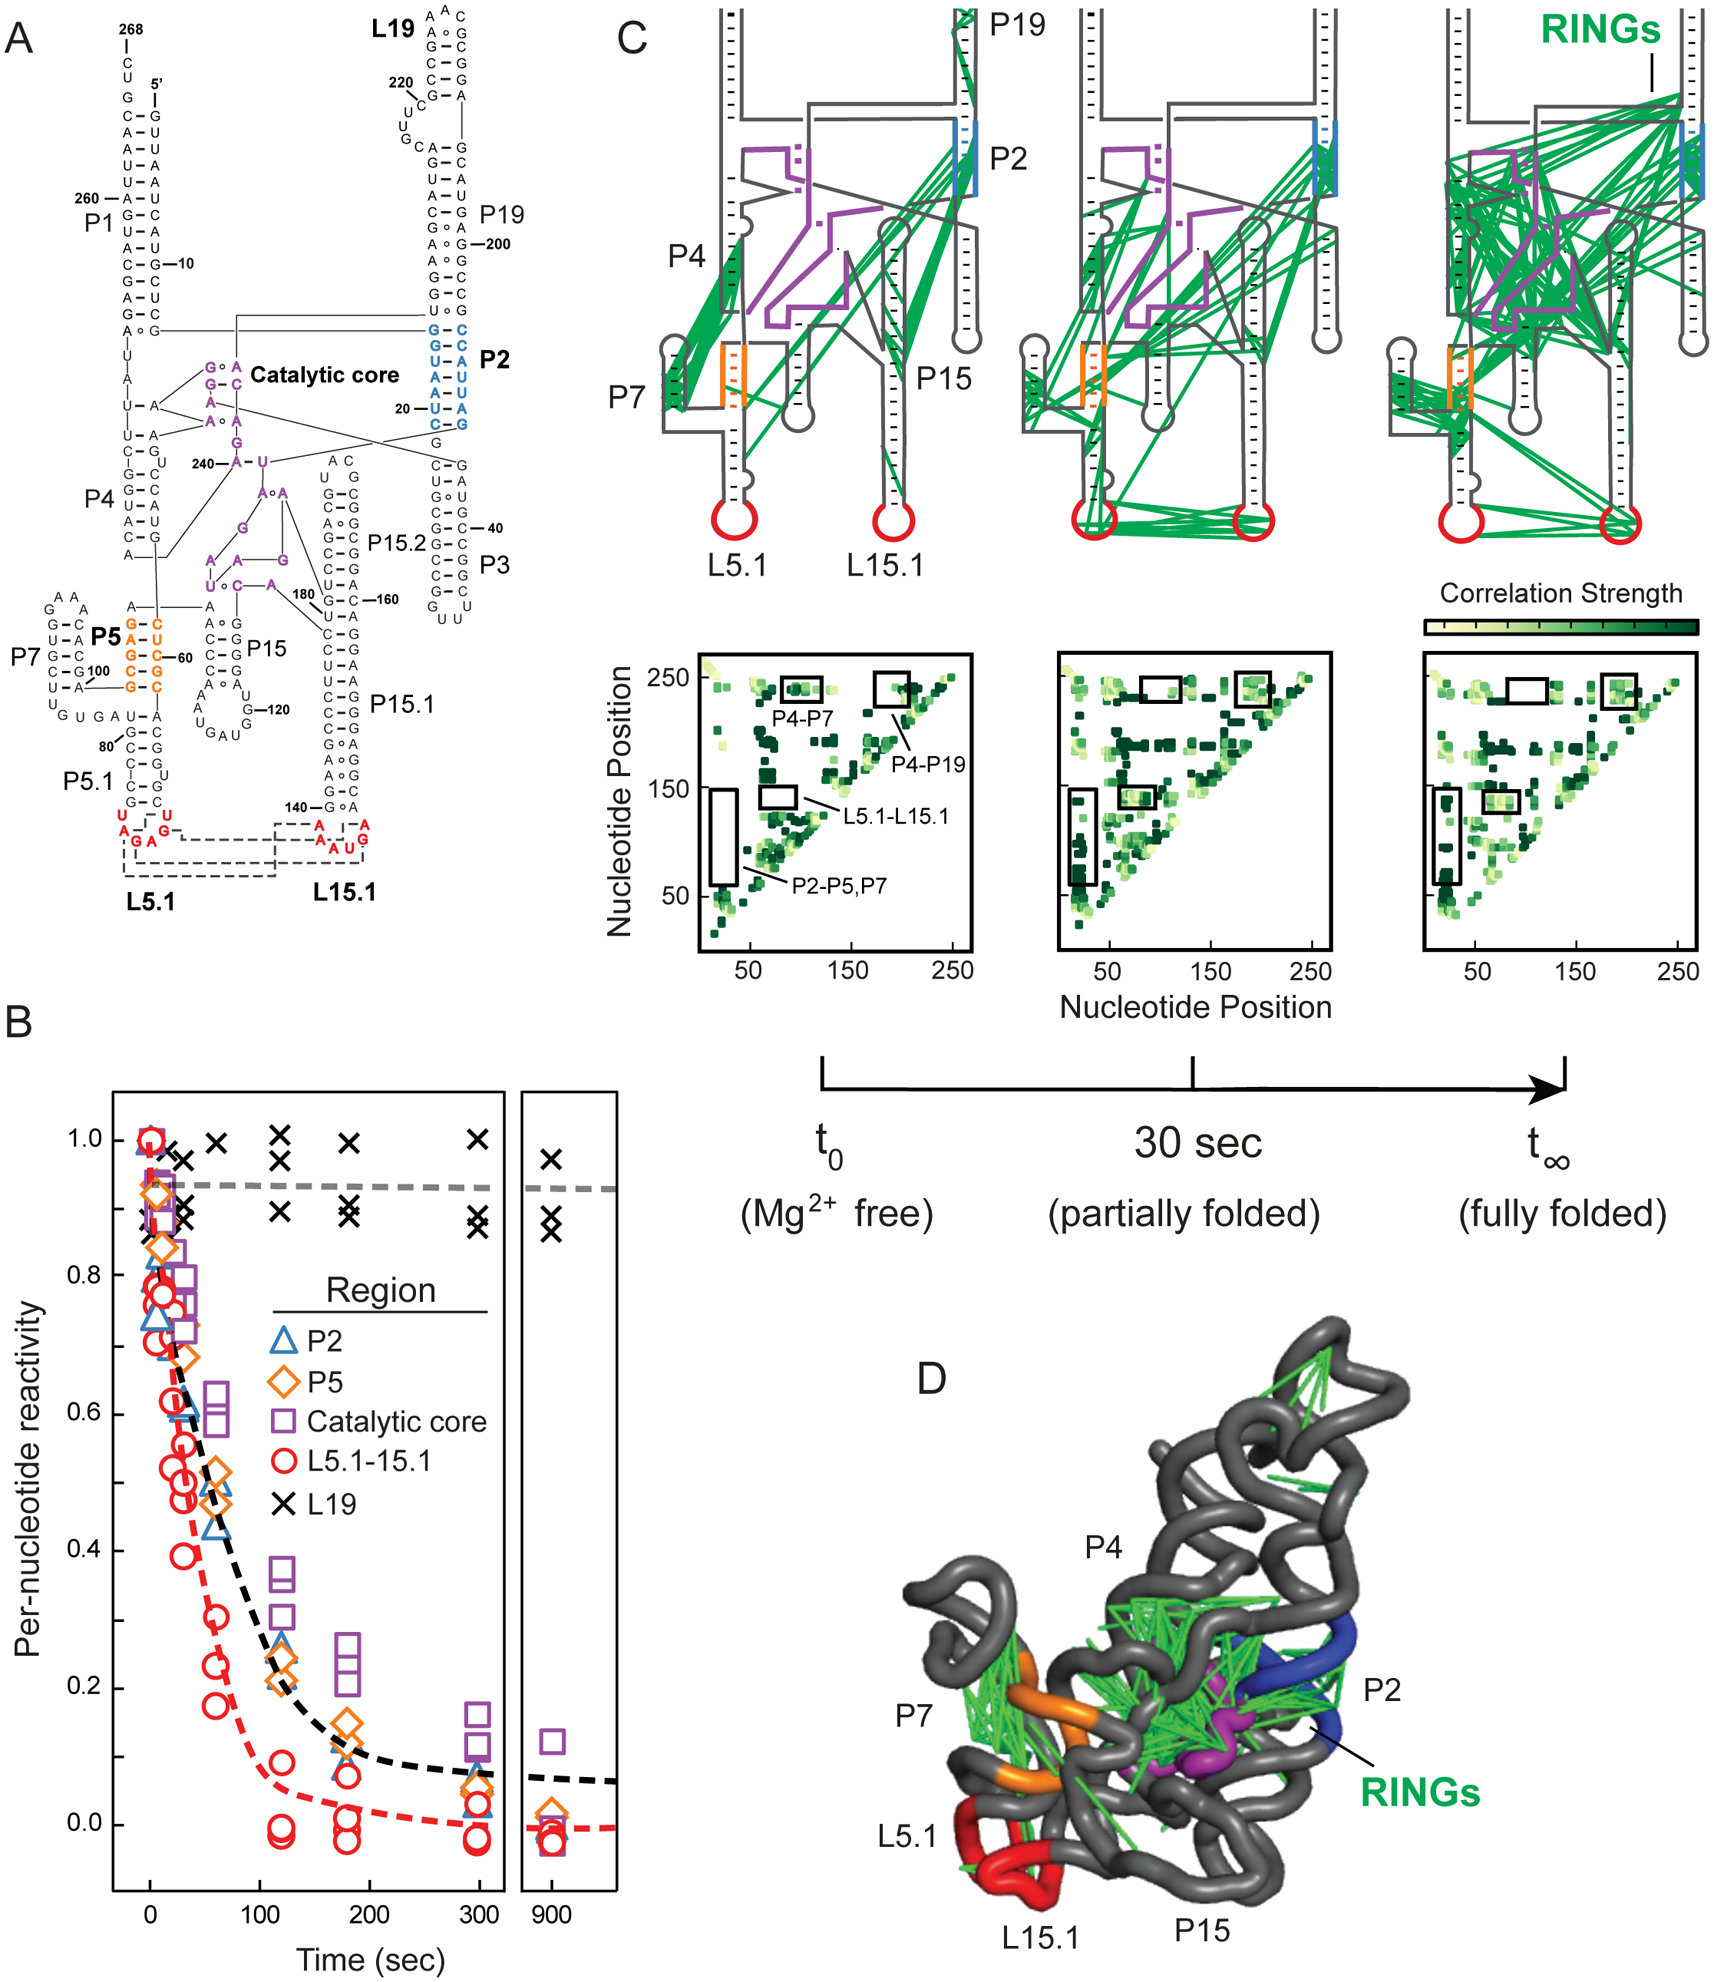
Figure 3.

Time-resolved folding of the RNase P RNA. (A) Secondary structure. Regions undergoing folding transitions upon Mg2+ addition are emphasized in color (in all panels). (B) Time-dependent reactivity profiles. Individual per-nucleotide reactivities are shown as points. Red and black lines show best fits to averaged reactivities for nucleotides that form the L5.1-L15.1 interaction and for all other folding motifs. Rate constants are 0.030 and 0.011 sec–1, respectively. Representative unchanging region is shown with × and gray line. (C) Pairwise through-space RING-MaP correlations as a function of folding time. Inter-nucleotide correlations are shown with green lines superimposed on secondary structure; heatmaps of same data are shown below each panel, with key regions boxed and labeled. (D) Three-dimensional structure of RNase P RNA15, with superimposed RING correlations.
