Figure 3.
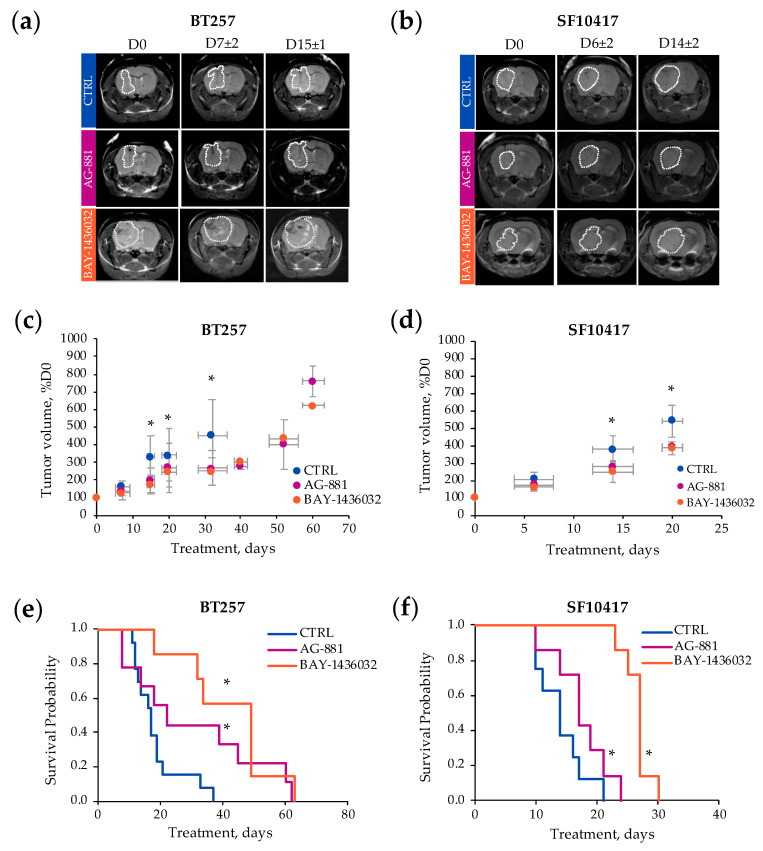
Representative axial T2-weighted images of control (top line, blue), AG-881 (middle line purple) and BAY-1436032 (bottom line orange)-treated BT257 tumor-bearing mice at D0, D7 ± 2 and D15 ± 1 (a) and SF10417 tumor-bearing mice at D0, D6 ± 2 and D14 ± 2 (b). Temporal evolution of average tumor volume (percentage of D0) for the BT257 (c) and the SF10417 (d) models (control in blue, AG-881 in purple, BAY-146032 in orange). Kaplan-Meier survival plot of BT257 (e) and SF10417 (f) tumor-bearing mice treated with either AG-881 or BAY-1436032 when compared to controls. * p-value ≤ 0.05.

