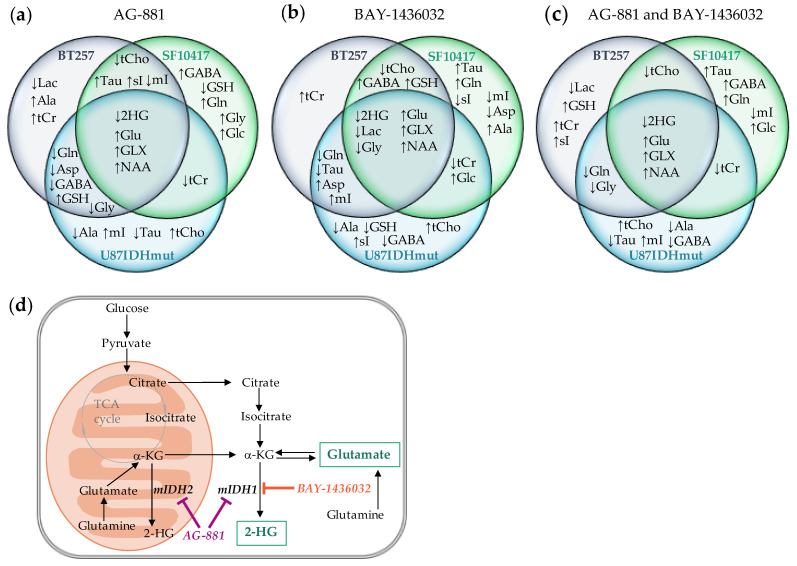
Figure 5.
Diagrams of metabolic alterations occurring in U87IDHmut, BT257 and SF10417 models at early time points (D5 ± 1 for U87IDHmut model (blue), D7 ± 2 for BT257 model (grey) and D6 ± 2 for SF10417 model (green)) prior to MR-detectable differences in tumor volume, following treatment with mutant IDH inhibitors AG-881 (a) or BAY-1436032 (b). Diagram showing changes that occur in each model with both treatments and highlighting the metabolic changes that occur for all models with both treatments (intersection of all three circles at center) (c). Metabolic pathways illustrating the MR-detectable metabolites altered following mutant IDH1/2 inhibition (d).

