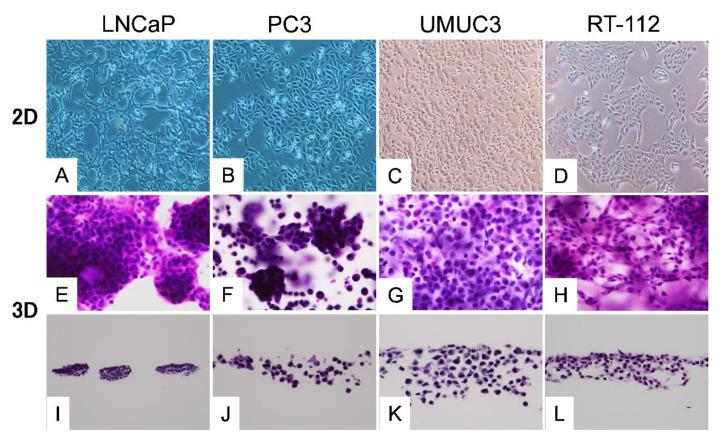
Figure 1.
Histology of each cell line. A–D: Two-dimensional (2D) culture. E–H: The cells cultured in three-dimensional (3D) culture for 2 weeks were directly HE-stained together with Cellbed. I–L: The vertical cross-sections of the Cellbed sheets. In 2D, all cell lines showed planar growth (A–D). In 3D, highly differentiated LNCaP cells showed nodular growth (E,I), whereas PC-3 cells with poor differentiation showed a mixture of cancer cells that formed small agglomerates and those that existed alone (F,J). UMUC3 cells with poor differentiation showed solitary but invasive growth (G,K). RT-112 cells showed loose binding and spindle shape (H,L).

